Node.js REPL, Inspector, Watch Mode, and SEA
Several runtime tools ship inside the same node executable that runs your application code. The REPL gives you an interactive prompt inside a live process. The inspector opens a debugging interface into that process. Watch mode owns a restart loop around that process. Single executable application support changes how the process finds and starts your application code.
They can look like small command-line conveniences, but each one changes how the process behaves. Some change the evaluation environment. Some expose runtime state. Some restart the program. Some package startup code into the executable itself. Once you use them outside a tiny local experiment, you need to know exactly what process state they touch.
Tools at the Process Edge
The REPL evaluates code interactively. The inspector lets debugging tools observe and control runtime state. Watch mode restarts a process when files change. SEA packages a Node application into a single executable artifact.
Those tools sit close to the process boundary, so small details can become real operational behavior. An inspector endpoint can expose code execution. A REPL can mutate live objects. Watch mode can restart a process while external resources are still cleaning up. A SEA build can change where your code expects files, assets, and modules to live.
Start with the smallest surface. Run node with no file and the executable becomes an interactive prompt -
$ node
> process.version
'<current-version>'
> os.platform()
'linux'
That prompt is the REPL - read, evaluate, print, loop. It reads one input unit, evaluates it inside a persistent JavaScript environment, prints the result, then waits for the next input.
The loop is literal. The process stays alive because the REPL keeps input and output streams active, usually process.stdin and process.stdout, and keeps feeding source text to the evaluator.
That is the first thing to get clear. A REPL session may feel like a scratchpad, but it is still a real Node process. Bindings stay around. Built-in modules are reachable. The current working directory is process state. The same process object is available. If you change process.env.DEBUG, you changed it for the current process. If you require() a module, that module enters the normal CommonJS cache. If an expression throws, the REPL catches that error for the current input turn and gives you the prompt again.
The prompt is temporary. The process state you touched can keep living.
The REPL Context
A REPL context is the environment used when the prompt evaluates your input. The standalone CLI REPL uses the JavaScript global context. A REPL created from application code usually gets a separate context unless you pass useGlobal: true.
You can see the persistent context as soon as a value survives from one input to the next -
> const port = 3000
undefined
> port
3000
The binding survives because the REPL keeps the context alive between evaluations. A script file is different. It runs once, then exits when there is no more work to do. A REPL keeps accepting input, and each input turn runs against the same session state.
The default REPL evaluator also adds a few conveniences that normal files do not get. Core module names can resolve on demand at the prompt -
> fs.existsSync('package.json')
true
> path.basename(process.cwd())
'nodebook'
Here, fs and path are available because of REPL evaluation rules. A normal .js file still needs require('node:fs'), require('node:path'), or imports. The directory name shown here is only sample output. Your REPL prints the basename of the directory where the process started.
That current working directory becomes the base for many quick experiments. process.cwd() is whatever directory the process had when the REPL started, unless you changed it with process.chdir(). A relative fs.readFileSync('x') call uses that directory. A relative CommonJS require('./x') from the standalone REPL also resolves from the current working directory used by the REPL's synthetic main context.
That is different from a normal module. A normal module resolves relative imports from its own file location. The REPL line you typed has no real source file, so path-sensitive experiments can behave differently from file-based code.
Result printing has its own layer too. The REPL sends results through a writer function. The default writer uses util.inspect(), which is why objects print in inspection format instead of JSON format.
The previous result is assigned to _ until you assign _ yourself. The previous error is assigned to _error under a similar rule.
> [1, 2, 3]
[ 1, 2, 3 ]
> _.length
3
That underscore value is handy while inspecting things, but it is still session state. Treat it as a prompt convenience, not as a program pattern.
Underneath the prompt, there is more structure than it first appears. The REPL receives bytes from the input stream. readline turns terminal input into submitted lines, handles editing, and keeps multiline input buffered when needed. Then the REPL server decides what the submitted line is.
It may be a special REPL command. It may be incomplete JavaScript that needs more lines. Or it may be complete JavaScript ready for evaluation.
Special commands run against the REPLServer. Incomplete JavaScript stays buffered. Complete JavaScript goes to the evaluator with the submitted code, the context object, a resource name used for diagnostics, and a callback that receives either an error or a value.
That callback shape is used even when the code you typed looks synchronous. A custom evaluator can finish later, and the default evaluator still reports completion through the same shape. The prompt comes back after the evaluator calls back and the writer finishes formatting the result.
The default evaluator compiles submitted source as interactive code. It is close to normal JavaScript evaluation, but it is not the same path as loading a file through the CommonJS loader. The REPL already has a context. It also wraps evaluation so it can keep bindings alive, expose core modules on demand, support top-level await, assign _, and recover when syntax needs more lines.
When Node sees syntax that looks unfinished, it can treat the situation as recoverable internally and keep collecting input instead of printing an error right away -
> function f() {
| return 1
| }
undefined
> f()
1
The | prompt means the REPL is holding buffered input. Node v24 changed the multiline indicator to that pipe and added multiline history support. The evaluator did not run the function declaration after the first line. It waited until the buffered input formed a complete unit.
REPL context state and module cache state are separate. A const binding you create in the prompt belongs to the REPL's evaluated environment. A module loaded with require() belongs to the CommonJS module cache.
In a separate-context REPL, .clear resets that context and aborts pending multiline input. In the standalone global-mode REPL, declarations and global mutations can survive. Loaded modules, open handles, changed environment variables, monkey-patched built-ins, active timers, and mutated objects can also remain because they live outside the context object.
That is the first serious REPL lesson. The prompt feels disposable. The process is still real.
REPL history is another piece of session behavior. The standalone CLI REPL stores history across sessions unless configured otherwise. In Node v24, multiline history is preserved with the | prompt indicator, and previous multiline entries can be edited when brought back from history. Programmatic REPLs need explicit history setup with replServer.setupHistory() if you want file-backed history.
Dot-prefixed commands are handled by the REPL server before JavaScript evaluation. .help lists the available commands. .exit closes the session. .clear resets a separate REPL context and aborts pending multiline input. .save writes the current session to a file in the current directory. .load feeds a file into the current session. .editor switches the prompt into multiline editor mode.
> .help
> .save scratch.js
> .exit
Those commands are REPL control input. They are not JavaScript syntax.
Signals and TTY behavior sit below that control layer. Pressing Ctrl+C once aborts the current input or evaluation path. Pressing it twice on a blank prompt exits. Ctrl+D exits. Tab asks the REPL for completion candidates. Those features depend on terminal behavior around the input stream, so a REPL connected to plain non-TTY streams gets a smaller feature set.
Await at the Prompt
REPL top-level await means you can use await directly at the prompt -
> await Promise.resolve(42)
42
> await fs.promises.stat('package.json')
Stats { dev: 66307, mode: 33188, ... }
Top-level await already exists in ES modules, and async execution has its own rules. The REPL version is an interactive convenience. One prompt turn can pause until the awaited Promise settles. Then the REPL prints the fulfilled value or reports the rejection.
That does not make the REPL a disk-backed ES module. CommonJS conveniences still exist. Core modules can still be available by name under the default evaluator. If you need ESM loading behavior, use import() from the prompt -
> const { readFile } = await import('node:fs/promises')
undefined
> await readFile('package.json', 'utf8').then(s => s.length)
1361
The 1361 value is sample output. Your project prints whatever length its local package.json has.
There is one scoping edge worth knowing. Node's docs call out that REPL await can affect normal const lexical behavior in some interactive cases. Assignment can behave differently after an awaited declaration, while redeclaration still throws -
> const x = await Promise.resolve(1)
undefined
> x = 2
2
> const x = 3
Uncaught SyntaxError: Identifier 'x' has already been declared
For quick inspection, that behavior is usually fine. If you are testing module-loading behavior or lexical scoping, move the code into a file. Then the loader and scope rules match the program you actually plan to run.
Await also changes prompt timing. The REPL receives a complete input unit, starts evaluation, sees that the result path is asynchronous, and waits before printing the final value. The event loop still keeps moving while the Promise is pending. The prompt simply does not accept the next input turn until the awaited expression settles.
> setTimeout(() => console.log('timer'), 10)
Timeout { ... }
> await new Promise(r => setTimeout(r, 50))
timer
undefined
The timer fires while the awaited Promise is pending. The REPL is interactive, but it is still the same process with the same event loop and microtask behavior covered earlier. The prompt waits for the evaluation result. The runtime continues processing work.
This is different from top-level await in a module. Top-level await in a module participates in module linking and evaluation. That affects import ordering, cycles, and startup failures. REPL await participates in one interactive evaluation turn. A REPL session has context state and whichever modules you load during that session.
Package scopes follow the same split. A file named tool.mjs runs through the ES module loader. A package with "type": "module" changes how .js files load. The REPL does not become one of those files. It can import modules, require built-ins and CommonJS modules, and await Promises, but it remains an interactive evaluator with its own context rules and convenience bindings.
--no-experimental-repl-await disables top-level await in the REPL. The flag name still carries the older label. In Node v24, REPL await is enabled by default.
Embedding a REPL
node:repl is the built-in module for creating REPL servers from your own code. An embedded REPL starts inside another program instead of starting from node with no entrypoint.
import repl from 'node:repl';

const r = repl.start({ prompt: 'admin> ' });
r.context.pid = process.pid;
repl.start() returns a REPLServer. That server reads from an input stream, writes to an output stream, evaluates submitted commands, and exposes a context object. Assigning pid above makes pid visible inside the prompt as a local value.
By default, the REPL uses process.stdin and process.stdout. Passing different streams lets tools build local sockets, test harnesses, or controlled admin consoles around a REPL. The streams decide how interactive the session feels. TTY input and output streams enable colors, line editing, completion previews, and key handling. Plain streams get text in and text out.
Custom context values are the main reason to embed a REPL -
import repl from 'node:repl';

const state = { requests: 0 };
const r = repl.start('ops> ');

r.context.state = state;
r.context.close = () => r.close();
Inside the prompt, state.requests reads the same object the program mutates. That is useful because the REPL can inspect live process state. It is risky for the same reason.
An embedded REPL can expose live internals. If you put a database client in the context, the prompt can query the database. If you put a cache object there, the prompt can mutate it. If the REPL uses useGlobal: true, evaluated code can see and modify global process state. Object properties are writable unless you define them differently.
Use Object.defineProperty() for read-only context values -
import repl from 'node:repl';

const r = repl.start('ops> ');

Object.defineProperty(r.context, 'config', {
  enumerable: true,
  value: Object.freeze({ region: 'iad' }),
});
That freezes the object you provide and makes the context property stable. Nested objects still need their own policy. The REPL follows normal JavaScript object rules.
Custom evaluators exist too. They receive the input text, the context, a resource name, and a callback. That path is useful when the prompt should behave like a command interface instead of a JavaScript prompt. For this chapter, the built-in evaluator is enough. The runtime behavior to remember is simple - embedding a REPL adds an interactive code execution path inside the process.
The useGlobal option controls how much the REPL shares with the host program -
import repl from 'node:repl';

repl.start({
  prompt: 'global> ',
  useGlobal: true,
});
With useGlobal: true, evaluated code uses the JavaScript global object as its context. The standalone CLI REPL uses that mode. With the default false for repl.start(), Node creates a separate context for the REPL instance.
Separate does not mean empty. Built-ins and global-like names are still available. Values you attach to r.context still point at the original objects you provided. The difference is that assignments to the REPL's global-like object are not assignments to the host globalThis.
That split helps when you want a narrow inspection context. It does not make live objects safe by itself. A separate context containing server, db, or cache still exposes those objects. If the object has a method that mutates state, the REPL can call it.
Input and output streams create another access path. An embedded REPL connected to process.stdin competes with the application for terminal input. A REPL connected to a Unix socket, TCP socket, or custom stream moves the prompt somewhere else. Node does not add access control because you changed streams. The stream is the transport. Your program owns the policy for who can reach it.
Embedded REPLs also affect shutdown. A live REPL keeps input open. If the rest of the program finishes but the REPL still has an active input stream, the process can stay alive. Calling r.close() closes the REPL server. Closing the underlying stream can also end the session. If you embed a REPL for local diagnostics, wire it into the same shutdown path as the rest of the process so it does not keep the event loop active after useful work is done.
Keep embedded REPLs local unless you have a separate security design. Authentication, authorization, audit logs, and network exposure belong to later operational chapters. The runtime behavior here is direct - a REPL server accepts input and evaluates it with access to whatever context and process state you gave it.
The Inspector Endpoint
The inspector is Node's debugging interface to the V8 inspector backend. It exposes runtime state through the Inspector Protocol, a JSON message protocol used by debugger frontends and programmatic clients.
Start a process with an inspector endpoint -
node --inspect app.jsNode opens a WebSocket endpoint, usually on 127.0.0.1:9229, and prints a URL that starts with ws://. A debugger connects to that URL and sends protocol commands. Node routes those commands into V8 and Node's inspector integration, then sends responses and events back over the same connection.
The startup variants decide when your application code begins running -
node --inspect app.js
node --inspect-brk app.js
node --inspect-wait app.js
--inspect starts the endpoint and begins running the program. --inspect-brk starts the endpoint and breaks before user code runs. --inspect-wait starts the endpoint and waits for a debugger to attach before running user code. The last two can block startup until a debugger resumes execution.
All three accept an optional host and port. Port 0 asks the operating system for an available port.
The path from flag to debugger traffic is short -
node --inspect app.js
  -> parse inspector flag during startup
  -> open host:port for inspector messages
  -> publish a WebSocket URL
  -> debugger sends Inspector Protocol messages
  -> V8 and Node inspector agents answer
The Inspector Protocol groups commands into domains. Runtime.evaluate evaluates an expression. Debugger.enable turns on debugger events. Profiler.* and HeapProfiler.* are also available, but CPU profiles and heap snapshots belong to observability and performance chapters.
The debugger is not reaching into your process by sharing JavaScript objects. It sends protocol messages. The process replies.
A client discovers or receives the WebSocket URL, opens the connection, and starts exchanging messages with numeric IDs. Requests carry method names such as Runtime.evaluate or Debugger.setBreakpointByUrl. Responses carry the same ID so the client can match each response to the request that caused it. Events arrive without being tied to a specific request. In Node's API, those events are called notifications.
A Debugger.paused notification can arrive because the process hit a breakpoint, because a debugger statement ran, or because the client asked execution to pause.
That request-response-plus-events shape explains how node:inspector works. A posted command can finish with a result, while the same session also receives events -
client -> {"id":1,"method":"Runtime.evaluate",...}
client <- {"id":1,"result":{...}}
client <- {"method":"Debugger.paused","params":{...}}
Protocol domains map to agents inside V8 and Node's inspector integration. The Runtime domain can evaluate expressions and expose object previews. The Debugger domain can report parsed scripts and control breakpoints. The Console domain can forward console activity. Node also has integration points for network-related inspector events behind experimental flags in v24, but those belong to tooling integration rather than the core debugging model here.
Object inspection over the protocol uses handles, previews, and explicit release commands. A debugger frontend can ask for a remote object, show a preview, then request more properties. The frontend is not holding the original object by direct reference inside its own JavaScript heap. The inspected process keeps the runtime objects. The protocol describes them.
That split is why a paused process can still show object state to a tool running somewhere else.
Pausing changes execution. When the debugger pauses the main thread, JavaScript execution stops at a known point. The event loop does not keep running user JavaScript while that thread is paused. Timers and I/O readiness can pile up behind the pause. Resume hands control back. That is fine during local debugging. It is a production incident if it happens on the wrong process.
Binding the inspector to a public address exposes a debugging interface that can evaluate code. The safe development default is loopback. 127.0.0.1 means local clients. 0.0.0.0 means clients that can route to that port may try to connect. Firewalls, tunnels, containers, and remote hosts can change who can reach it. Treat the host binding as a security decision.
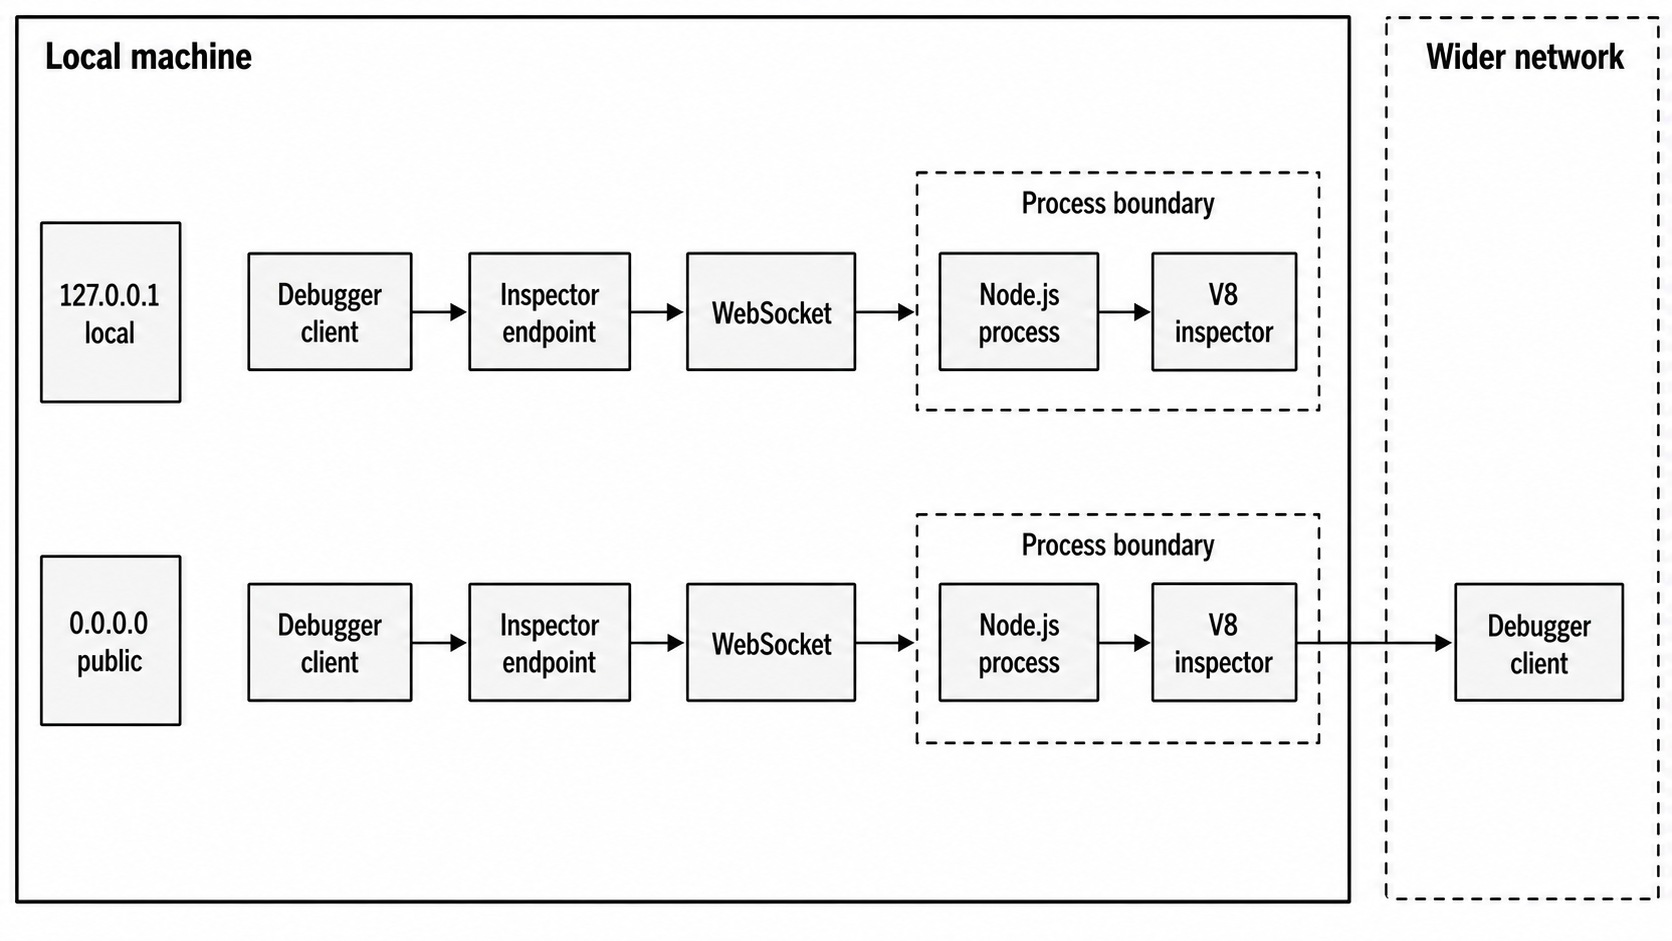
Figure 1 - The inspector endpoint is a process-level debugging interface. Loopback keeps the client local. Public binding makes reachability part of the security model.
--inspect-publish-uid controls where Node publishes the inspector URL. The default includes stderr and HTTP discovery. That helps tools find the target. It also means the URL can land in logs. The URL contains a generated identifier, but the host and port are the real exposure point.
--inspect-brk and --inspect-wait affect startup, so they also affect preloads. A preload from --require or --import is startup work. When the debugger breaks before user code, the exact stop point depends on the mode and loader path. The purpose is to let the debugger observe code before the application entrypoint has gone far. That helps when the bug sits in configuration bootstrap, preload instrumentation, or top-level module evaluation.
The inspector can also be controlled through startup flags. --disable-sigusr1 prevents the older Unix SIGUSR1 inspector activation path. When the permission model is enabled with --permission, programmatic inspector access is blocked unless startup also includes --allow-inspector. Runtime permissions are deferred in this curriculum. The local takeaway is that the inspector is a process capability. Decide at startup whether the process may expose it, then keep programmatic calls aligned with that decision.
Inspector Sessions from Code
node:inspector is the built-in module for interacting with the inspector from JavaScript. It can open the endpoint, return its URL, wait for a debugger, and create inspector sessions.
import inspector from 'node:inspector';

const disposable = inspector.open(0, '127.0.0.1');
console.log(inspector.url());

disposable[Symbol.dispose]();
inspector.open() activates the inspector after the process has already started. The first argument is the port. 0 asks for a random available port. The second argument is the host. In Node v24, the call returns a Disposable. Disposing it closes the inspector through inspector.close().
inspector.waitForDebugger() blocks until a connected client sends Runtime.runIfWaitingForDebugger. It throws when no inspector is active.
import inspector from 'node:inspector';

inspector.open(9229, '127.0.0.1');
console.error(inspector.url());

try {
  inspector.waitForDebugger();
} finally {
  inspector.close();
}
That code intentionally stops the current thread. It gives a debugger time to attach before later code runs. Use that when startup state is the thing you need to inspect. Remove it from normal service startup.
An inspector session is a client object connected to the inspector backend. The callback API lives in node:inspector. The Promise API lives in node:inspector/promises. In Node v24, node:inspector/promises is Stability 1, experimental, while the main node:inspector module is stable.
import { Session } from 'node:inspector/promises';

const session = new Session();
session.connect();

try {
  const out = await session.post('Runtime.evaluate', {
    expression: 'process.pid',
  });
  console.log(out.result.value);
} finally {
  session.disconnect();
}
session.connect() attaches the session to the inspector backend. session.post() sends an Inspector Protocol command. The result structure comes from the protocol. For example, Runtime.evaluate returns a protocol object with fields such as type, value, and description.
Sessions extend EventEmitter, so notifications can be observed by event name on the connected session -
session.on('Debugger.paused', ({ params }) => {
  console.log(params.reason);
});
Same-thread debugging has limits. A session connected inside the same thread can send commands into the runtime currently executing the session code. Breakpoints on that same path can pause the debugger client and the debugged execution together. Worker inspection has its own rules and belongs later. For this chapter, keep the model narrow. Use programmatic sessions for controlled protocol commands. Use an external debugger for interactive stepping.
Cleanup is part of the inspector lifetime. session.disconnect() drops protocol state such as enabled agents and configured breakpoints. inspector.close() blocks until active inspector connections close, then deactivates the endpoint. Library code should avoid opening or closing the inspector unless the caller clearly asked for that behavior.
The Promise API and callback API share the same backend. Pick one style for each call path. The Promise API is experimental in Node v24, and it reads nicely in startup probes and one-shot scripts -
import { Session } from 'node:inspector/promises';

const s = new Session();
s.connect();

try {
  await s.post('Runtime.enable');
} finally {
  s.disconnect();
}
The callback API fits older code or places where the surrounding contract already uses callbacks. Either way, session.post() sends method strings defined by the Inspector Protocol. If you misspell a method name, the backend responds with a protocol error. If you pass the wrong parameter shape, the backend decides whether to reject it.
Keep programmatic inspector code short-lived unless you are building a debugger or diagnostic tool. Open the endpoint when the caller asked for it. Connect the session. Send the narrow command set you need. Disconnect. Close the endpoint if your code opened it.
Leaving an inspector endpoint around after a diagnostic action changes the exposed state of the process.
An inspector session can ask V8 for profiles and heap snapshots. That does not make the inspector module an observability system. It is a protocol client. Storage, sampling policy, privacy filtering, upload paths, retention, and production runbooks belong elsewhere. The useful skill here is knowing when you opened a debugger endpoint or sent a protocol command, and when you crossed into a broader operational concern.
Watch Mode
Watch mode restarts a process when watched files change -
node --watch src/server.jsThe --watch flag starts the entrypoint under Node's built-in restart loop. In Node v24, watch mode watches the entrypoint and any required or imported module by default. When one of those watched files changes, Node stops the current run and starts the program again.
That default helps with stale code during local development. If you edit a module that your app loaded, Node sees the change and restarts.
Path selection controls what else can trigger a restart -
node --watch-path=src --watch-path=config server.js--watch-path specifies paths to watch and also turns on watch mode. When you use it, Node watches those paths instead of auto-discovered required and imported modules. Node's v24 documentation describes --watch-path as supported on macOS and Windows, with unsupported builds throwing ERR_FEATURE_UNAVAILABLE_ON_PLATFORM. Verify the target Node binary before treating that as a universal rule. Node v24.15 on Linux can accept --watch-path and restart on watched-path changes. A missing watched path still fails before startup with a filesystem error such as ENOENT.
Watch mode expects an entrypoint file -
node --watch app.js
node --watch-path=src app.js
It does not combine with --check, --eval, --interactive, or the REPL. --watch-path also does not combine with --test. --run takes precedence and ignores watch mode.
Do not build a workflow around node --watch without an entrypoint. The CLI docs have described a missing entrypoint as a usage error, while Node v24.15 on Linux can exit 0 after printing that it completed running an empty input. Give watch mode an entrypoint file or a package script.
The watch restart signal is the signal Node sends to stop the running process before starting the next one. Node v24.4 added --watch-kill-signal for choosing that signal. In Node v24, it is marked Stability 1.1, active development.
node --watch --watch-kill-signal SIGINT app.jsThe signal changes shutdown behavior because your process may handle SIGINT, SIGTERM, or another supported signal differently. Signal handling already belongs to Chapter 5. The watch-specific lesson is smaller - restart means process termination followed by fresh startup. In-memory state disappears. Cleanup depends on the signal and the app's handlers.
By default, watch mode clears the console between restarts. You can preserve output when you want to keep previous logs visible -
node --watch --watch-preserve-output app.jsThat helps when the line explaining a failed restart gets cleared before you read it. Preserved output can also get noisy during fast edit cycles. Pick the behavior that helps the debugging task in front of you.
Watch mode uses file watching underneath, and file watching varies by platform. Editors can save by writing a temporary file and renaming it. Build tools can rewrite whole directories. Network filesystems can coalesce or delay events. Node's watch mode sits on top of those platform signals and turns a detected change into a restart decision.
The restart loop has two sides. One side tracks files. The other side owns a running process. When the watcher reports a change, Node sends the configured restart signal to the current run, waits through its shutdown path, and launches a new run with the same entrypoint and execution arguments.
The new run starts with a fresh JavaScript heap, fresh module caches, and a fresh startup sequence. External resources stay external. Ports, files, databases, sockets, and child processes follow their own cleanup behavior.
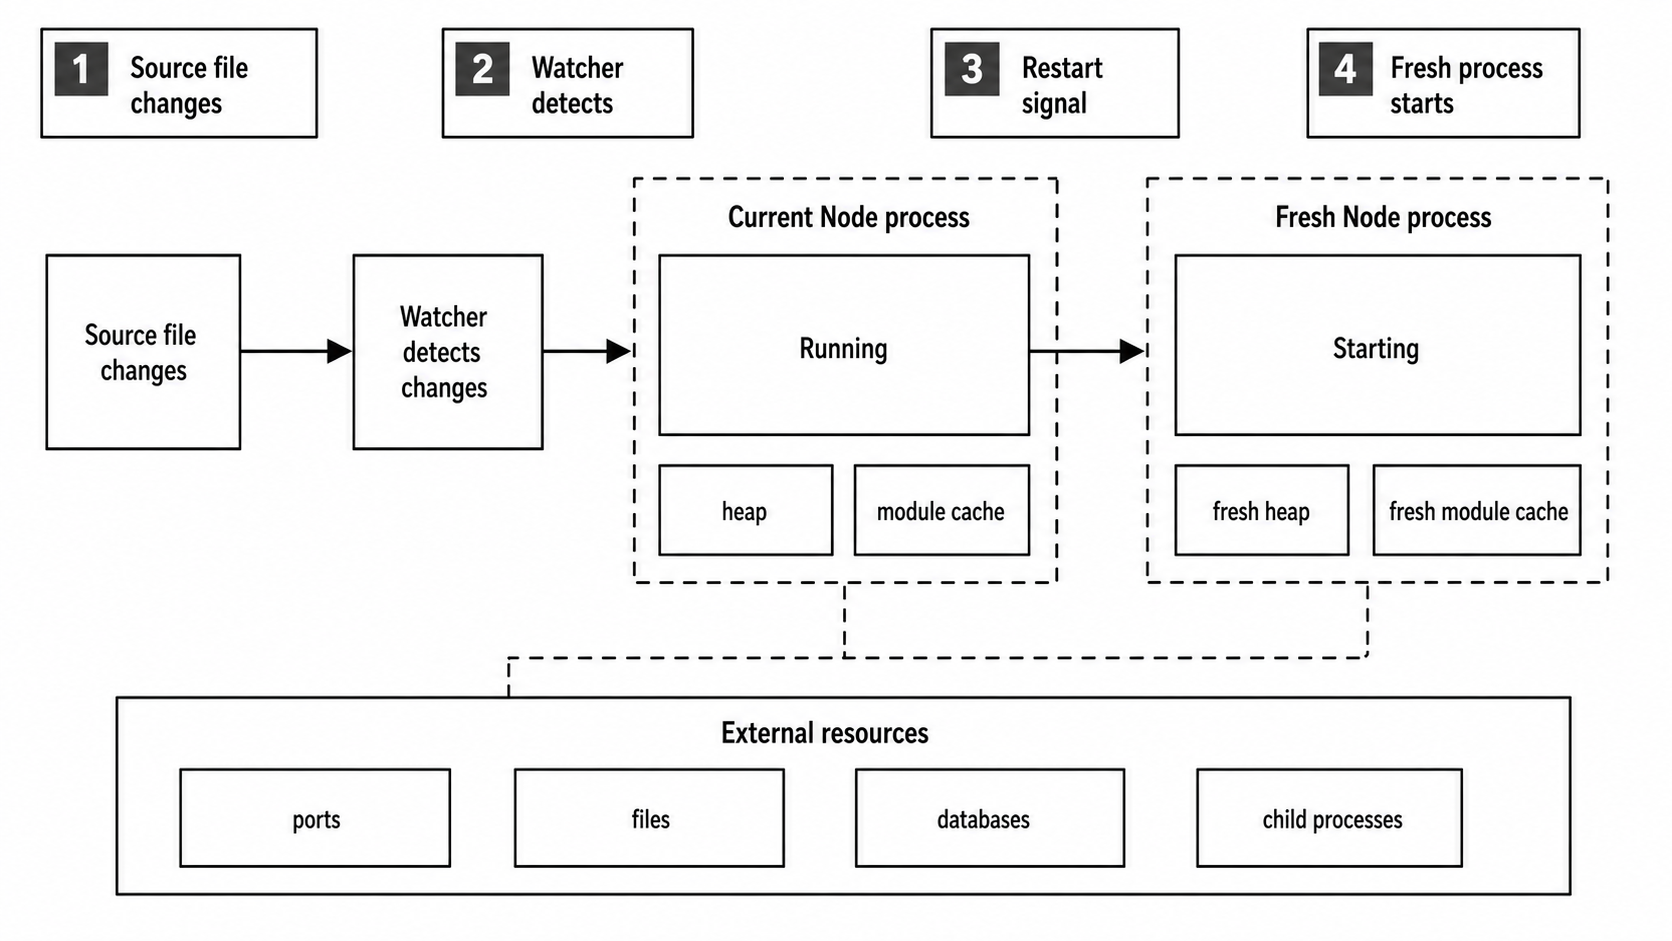
Figure 2 - Watch mode restarts the whole process. JavaScript heap state and module caches start fresh, while external resources still need normal cleanup policy.
That difference explains messy restarts. A server that handles SIGINT and closes its listening socket will usually restart cleanly. A server that ignores the restart signal can keep a port busy and leave watch mode waiting for graceful termination until the process exits. A child process spawned by the app can outlive the watched parent if the app never tracks and terminates it.
Watch mode starts the next run. Your shutdown code controls what the previous run leaves behind.
Generated files need attention. Suppose src/server.js imports src/routes.js, and a build step writes src/routes.generated.js twice per save. Default --watch can see imported modules and restart on changes there. --watch-path=src may see both source and generated writes. In both cases, restart frequency comes from the filesystem events Node receives. Keep generated output outside watched paths when possible, or point watch mode at a narrower directory.
Watch mode restarts the program. It does not reload code inside the same process. If you need in-memory state to survive edits, that is a different design. For ordinary backend development, restart-from-zero is useful because startup bugs, module side effects, and configuration loading run again.
NODE_OPTIONS and CLI flags still apply. This command keeps the same runtime configuration on each restart -
NODE_OPTIONS="--enable-source-maps" \
node --watch --import ./boot.mjs app.js
Every new run gets the source-map setting and preload. If the preload changes and sits in the watched module graph or watched path, the process restarts and runs the new preload. If it lives outside the watched set, edit detection depends on the flags you chose.
Watch mode has a few small terminal failure cases. Clearing output can hide the first stack trace after a fast restart. Preserving output can leave several failed startups on screen and make the current one harder to find. A syntax error can cause the new run to exit immediately while the watcher stays alive, waiting for the next edit. That behavior is useful during local development because a broken save does not kill the watch command itself.
The file list is runtime-derived unless you supply watch paths. Imported modules enter the watched set after they are loaded. Lazy imports may join later. A file that the process reads with fs.readFile() is data, not a module, so default watch mode may have no reason to track it. Use --watch-path when data files should trigger restarts, and verify the option on the Node build that will run the command.
The Node test runner has its own watch behavior, and --watch-path does not combine with --test. Keep those loops separate. Application watch mode restarts an entrypoint. Test watch mode reruns tests.
Watch mode also gives no transactional guarantee around a save. An editor can write half a file, rename it, then finish another related write a few milliseconds later. The watcher can restart between those writes. A TypeScript stripper, bundler, or code generator can do the same with output files. The fix usually sits outside Node - write generated output atomically, keep partial files outside watched paths, or watch the final built directory rather than every intermediate input.
Treat watch mode as a development tool. It is not a process manager. A process manager owns service supervision, backoff, logging policy, health checks, and boot ordering. Built-in watch mode owns edit-and-restart during local work.
Single Executable Applications
A single executable application, or SEA, is a Node executable with an application preparation blob injected into it. In Node v24, the SEA flow takes a bundled CommonJS script, builds a preparation blob with Node, injects that blob into a copy of the Node binary, and starts by running the embedded script when the executable launches.
A small SEA configuration looks like this -
{
  "main": "dist/cli.cjs",
  "output": "sea-prep.blob"
}
That JSON file is the SEA configuration. main points at the bundled script. output names the preparation blob Node should write. Generate the blob with the Node v24 SEA flag -
node --experimental-sea-config sea-config.jsonThe output file is the SEA preparation blob. It is a binary payload generated by Node from the configuration. It can contain the bundled script, embedded assets, optional execution arguments, optional V8 code cache, and optional startup snapshot data.
Blob generation must line up with the Node binary that will consume it later. Node's docs call that out because the preparation data is tied to the binary format and runtime. A blob from one Node version is the wrong input for a different Node binary. Keep process.version from the build step aligned with the copied executable.
The blob still has to be injected into an executable. In Node v24, that injection step is separate. A tool such as postject writes the blob into a copied Node binary under the resource name NODE_SEA_BLOB, then flips Node's SEA fuse string so the executable knows a blob is present.
The build flow looks like this -
sea-config.json
  -> node --experimental-sea-config
  -> sea-prep.blob
  -> copied node binary with injected blob
  -> launch executable
  -> Node detects blob and runs embedded main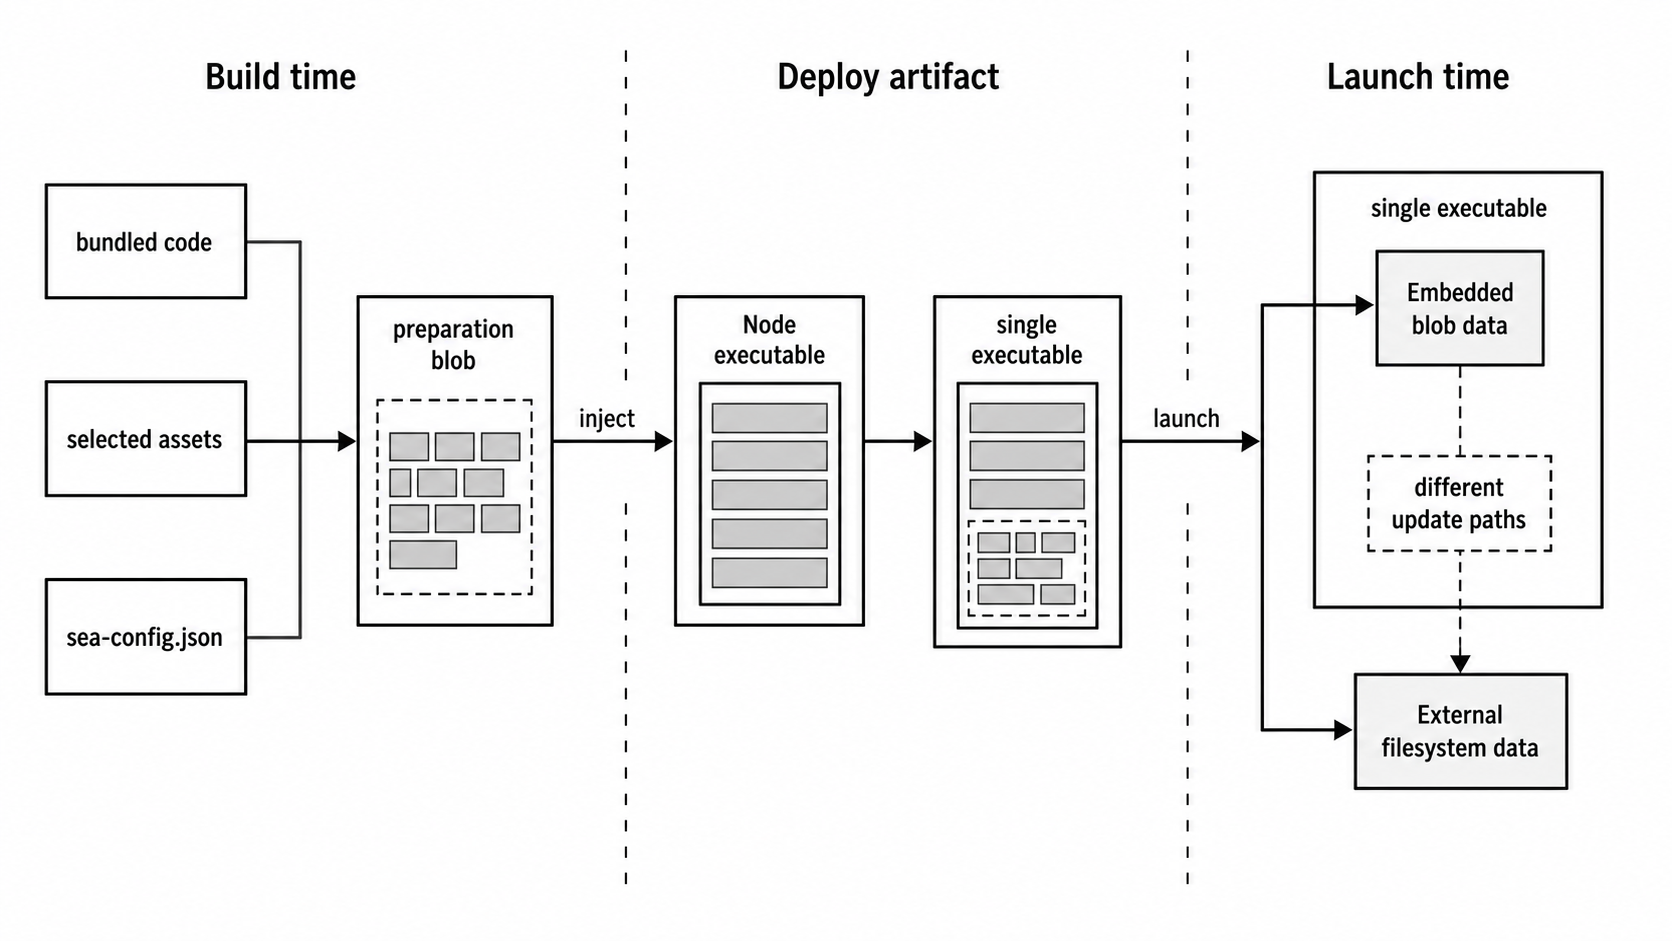
Figure 3 - A SEA build moves bundled code and selected assets into the executable. At launch, embedded blob data and ordinary filesystem data have different update paths.
The injection location depends on the platform. On Windows, the blob is injected as a PE resource. On macOS, it is injected as a Mach-O section in the NODE_SEA segment. On Linux, it is injected as an ELF note. Packaging tools care about those file-format details. At runtime, the behavior is simpler - startup checks the executable for an injected NODE_SEA_BLOB; when it finds one, Node runs the embedded application path.
Startup begins like any other Node executable. The operating system launches the binary, passes argv and environment, and Node initializes runtime state. The SEA path diverges when Node checks the executable for the SEA marker and blob. With no blob, the binary behaves like normal node. With a blob, Node uses the embedded application metadata and runs that main script instead of looking for a file entrypoint from the command line.
User arguments still exist. In the SEA execution-argument examples, process.argv[0] and process.argv[1] both point at the executable path, then user arguments begin at index 2. process.execArgv contains execution arguments configured through the SEA configuration and any permitted extension mechanism. This is close enough to normal Node for many CLI tools, but code that assumes process.argv[1] is a source file path will get the executable path instead.
SEA handles packaging. It does not bundle your dependency graph for you. Node v24's SEA feature runs one embedded CommonJS script. If your app depends on files from node_modules or your source tree, bundle that graph into the main CommonJS file before the SEA step.
The injected main script gets a narrow require(). It can load built-in modules, and it lacks most properties of normal file-based require() except require.main. If you need file-based loading, create a separate resolver deliberately -
const { createRequire } = require('node:module');

const fileRequire = createRequire(__filename);
const config = fileRequire('./config.cjs');
That gives the embedded script a file-based resolver rooted at __filename without replacing the injected require.
Inside a SEA main script, __filename and module.filename equal process.execPath. __dirname equals the directory containing the executable. Those values point at the executable, not at the original source file that produced the blob.
That file identity change can break quiet assumptions. Code that finds templates with path.join(__dirname, 'templates') now points beside the executable. Code that reports its own filename reports the executable. Code that expects a package root by walking up from __dirname walks up from the install location.
Some CLI programs want that behavior. Many server applications need a controlled config directory, cache directory, or data directory chosen through normal runtime configuration.
Assets are files bundled into the preparation blob under keys from the SEA configuration -
{
  "main": "dist/cli.cjs",
  "output": "sea-prep.blob",
  "assets": { "schema": "schema.json" }
}
Inside a SEA executable, node:sea exposes SEA-specific APIs -
const sea = require('node:sea');

if (sea.isSea()) {
  const schema = sea.getAsset('schema', 'utf8');
  console.log(schema.length);
}
node:sea is the built-in module for code running inside a single executable application. It can also be required outside a SEA. In that case, sea.isSea() returns false, and asset APIs such as sea.getAssetKeys() throw ERR_NOT_IN_SINGLE_EXECUTABLE_APPLICATION.
Inside an injected executable, sea.getAsset() returns a copy as a string or ArrayBuffer. sea.getAssetAsBlob() returns a Blob. sea.getRawAsset() returns the raw ArrayBuffer from the executable without copying. sea.getAssetKeys() returns the embedded asset keys in Node v24.8 and later.
Raw assets need care. The raw buffer points at memory associated with the injected executable section. Node's docs warn against writing to it because alignment and writability depend on how the binary was injected. Use getAsset() when a copy is fine. Use getRawAsset() only when avoiding a copy is part of a measured design.
Asset keys are application-level names. They are not filesystem paths unless you choose path-like strings. A key such as "schema" can point at schema.json during blob generation, then the embedded executable retrieves the bytes with sea.getAsset('schema').
Moving the original schema.json after build changes nothing about the already-built executable. Rebuilding the blob is the update path.
That behavior works well for small read-only data - schemas, templates, migration text, default configuration, local-development certificates, or help output. It is a poor fit for mutable state. Write mutable data to a real filesystem path chosen at runtime. The asset APIs read data injected into the executable.
Execution arguments can be baked into the SEA configuration -
{
  "main": "dist/cli.cjs",
  "output": "sea-prep.blob",
  "execArgv": ["--no-warnings"]
}
When the executable starts, those Node execution arguments are applied and appear in process.execArgv.
execArgvExtension controls whether extra Node execution arguments can come from NODE_OPTIONS, from a --node-options CLI argument, or from neither. The default is "env", which keeps NODE_OPTIONS active. That can surprise people who expected a packaged executable to ignore the parent environment.
The three extension modes behave differently -
| Mode | Behavior |
|---|---|
"none" | Accepts only execArgv from the SEA configuration and ignores NODE_OPTIONS. |
"env" | Accepts NODE_OPTIONS as an extension, matching normal Node startup behavior. |
"cli" | Accepts a --node-options="..." argument to the executable and parses those values as Node execution arguments instead of user arguments. |
Choose "none" for a packaged tool that should have a fixed runtime contract. Choose "env" when a platform wrapper still owns runtime settings. Choose "cli" when advanced users need an explicit escape hatch.
SEA code cache is V8 code cache stored in the preparation blob. With "useCodeCache": true, Node compiles the embedded main script while generating the blob and stores V8's cached compilation data. At launch, Node can use that cache while compiling the embedded script, which can reduce startup compilation work.
The cache is tied to platform and engine details. For cross-platform SEA generation, set useCodeCache to false.
There is also a specific import() edge. import() does not work when useCodeCache is true in this SEA path. If the embedded script uses import(), leave code cache off.
SEA startup snapshot support takes a different route. With "useSnapshot": true, the main script runs while generating the preparation blob on the build machine. The resulting blob contains serialized V8 heap state. At launch, Node deserializes that state and runs the function registered through v8.startupSnapshot.setDeserializeMainFunction().
Snapshot constraints belong to V8 and startup performance work later in the book. For this chapter, keep the model simple - code runs at blob generation time, heap state is captured, and launch starts from that captured state.
Snapshot generation changes when side effects happen. With the default SEA path, the embedded main script runs when the user launches the executable. With snapshot enabled, the main script runs while generating the blob. That means file reads, environment reads, random values, date reads, and initialization side effects may happen on the build machine unless you isolate them behind the deserialize main function.
A snapshot-friendly entrypoint separates build-time heap preparation from launch-time user work.
Code cache and snapshots share a portability limit. The generated data matches the platform and Node/V8 build that produced it. A blob prepared on one platform can fail when injected into a binary for another platform if it carries code cache or snapshot data. Plain script and asset blobs have fewer moving parts.
A clean SEA build keeps the steps separate -
- Bundle the application into one CommonJS file.
- Generate the preparation blob with the same Node version as the copied binary.
- Inject the blob into a clean copy of that binary.
- Run the executable in a directory that does not contain your source tree.
That last test catches accidental filesystem dependencies. If the executable still reaches into src/, node_modules/, or a local .env file you forgot about, the SEA build is still depending on your project layout.
The error modes usually show up at build or launch time. A missing asset key throws when node:sea cannot find it. A file-based require() throws when the embedded script asks for a dependency that was never bundled. A blob generated by one Node binary can fail when injected into another. A signed binary on macOS or Windows can lose its signature when modified and then fail platform policy checks until it is signed again.
SEA also changes update mechanics. Replacing schema.json beside the project no longer updates an embedded asset. Rebuilding the blob and reinjecting the executable updates it. Replacing a config file beside the executable still works if your program reads that runtime file from the filesystem.
The split is simple - blob data is build-time data, and filesystem data is launch-time data.
SEA also changes deployment assumptions around files. A normal Node app often reads relative files from its project directory. A SEA runs from an executable path. Assets included in the blob are available through node:sea. Files left beside the executable are regular filesystem files. Dependencies left in the original project tree are invisible unless the running process can still reach them through a configured file-based resolver.
Test that split before treating a SEA as a release artifact.
Native addons can be included as assets, but loading them still requires a real file path because process.dlopen() loads a native binary from the filesystem. The usual pattern writes the asset to a temporary file and then calls process.dlopen(). That is platform packaging work, and Chapter 31 owns the release strategy. At runtime, SEA assets give you bytes. Native loader APIs decide what can execute.
The feature is marked active development in Node v24. That label affects tooling compatibility. The high-level flow is clear enough to reason about, but exact generation commands, supported platforms, and helper tooling can change across Node releases. For Node v24 specifically, use --experimental-sea-config and injection.
Signing, notarization, installer layout, Docker images, and production release channels are deployment topics. The runtime platform piece ends at the executable's behavior - argv shape, embedded main script, assets, optional execution arguments, optional code cache, optional snapshot, and changed path semantics.
Production Edges
These tools all cross normal application code paths.
The REPL evaluates input inside a live process. An embedded REPL exposes whichever context values you attach. Keep it local, or wrap it with a real operational design.
The inspector opens a debugging endpoint. It can evaluate expressions, pause code, inspect memory, and emit profiling data through protocol domains. Loopback binding is the development default. Public binding is an exposure decision.
Watch mode owns restart-on-change for local iteration. It restarts from scratch and depends on file watching signals that vary by platform. It does not own service supervision.
SEA packages a Node runtime plus an embedded application payload into one executable. It changes path assumptions, module loading assumptions, and asset access. You still need to test startup flags, environment interaction, filesystem expectations, and platform-specific release steps.
These tools are useful because they run close to the process. That same closeness is why they need care. A prompt, a debugger port, a restart loop, and an injected executable all become part of how the process starts, stops, accepts input, and exposes state.