Node.js Buffer Allocation: Pools and Memory Safety
We've already discussed about allocation patterns in last two sub-chapters, and the different functions that Buffer provides, but we're going to go a bit deeper this time. I recommend you to open a code-editor side by side and try some of these examples yourselves. Also, tweak some values and observe the outcome.
Buffer allocation decides what kind of byte range your code receives. It can be a zero-filled range, an uninitialized range, a copy of existing data, or a view over memory owned somewhere else.
Most allocation bugs happen when those contracts get mixed up. A service can expose stale bytes because it sends memory it never wrote. It can waste CPU because it zero-fills or copies more than needed. It can also retain memory because a tiny Buffer view keeps a much larger backing store reachable.
The APIs to keep separate are Buffer.alloc(), Buffer.allocUnsafe(), Buffer.from(), the small-buffer slab pool, and separate backing stores for larger allocations. Each one has a purpose, but each one gives the caller a different safety and performance contract.
How Buffer Allocation Works
At the JavaScript level, these choices look like ordinary factory methods. Underneath, they decide how native backing memory is obtained and what state that memory is in before JavaScript can observe it.
Zero-filling protects against stale data by writing 0x00 across the requested range. Unsafe allocation skips that write and leaves initialization to your code. Pooling reduces native allocation overhead for small buffers by returning ranges from a shared slab instead of asking the native allocator for every small request.
That gives us the production default. Use Buffer.alloc() when a buffer may touch secrets, external input, responses, logs, or any path where unwritten bytes could be observed. Reserve Buffer.allocUnsafe() for code that immediately overwrites every byte and makes that guarantee obvious in review. Treat Buffer.from() as a family of conversions, not one simple operation, because its copying and sharing behavior depends on the input.
Decision Summary
When a service leaks bytes or spends measurable CPU time in Buffer allocation, the issue usually comes from one of three contracts.
-
Buffer.alloc(size)is the safe default. It allocates memory and initializes every byte before handing the Buffer to JavaScript, so reads from unwritten positions cannot expose leftover process data. The cost is the zero-fill itself. In ordinary request handling, that cost is usually small compared with I/O, parsing, database work, and application logic. In a tight binary processing path, it can show up in a profile. -
Buffer.allocUnsafe(size)skips initialization. Node can return memory without clearing it first, and small requests may come from an internal slab. The returned bytes are unspecified and may contain stale sensitive data from earlier work in the same process. If code exposes bytes it did not write, the bug is an information disclosure, not a harmless performance shortcut. -
Buffer.from(source)changes behavior based on the source. A string is encoded into bytes. An array of numbers is iterated and copied. AnotherBufferor aUint8Arrayis copied. AnArrayBuffercreates a view that shares the same backing memory, which means later writes through the original memory can change what the Buffer sees.
The review rule follows from those contracts. Start with alloc(). Use allocUnsafe() only when measurement proves the cost is real and the overwrite guarantee is close enough for a reviewer to verify. Inspect every from() call by source type, because the same factory name can mean either "copy these bytes" or "view this backing memory."
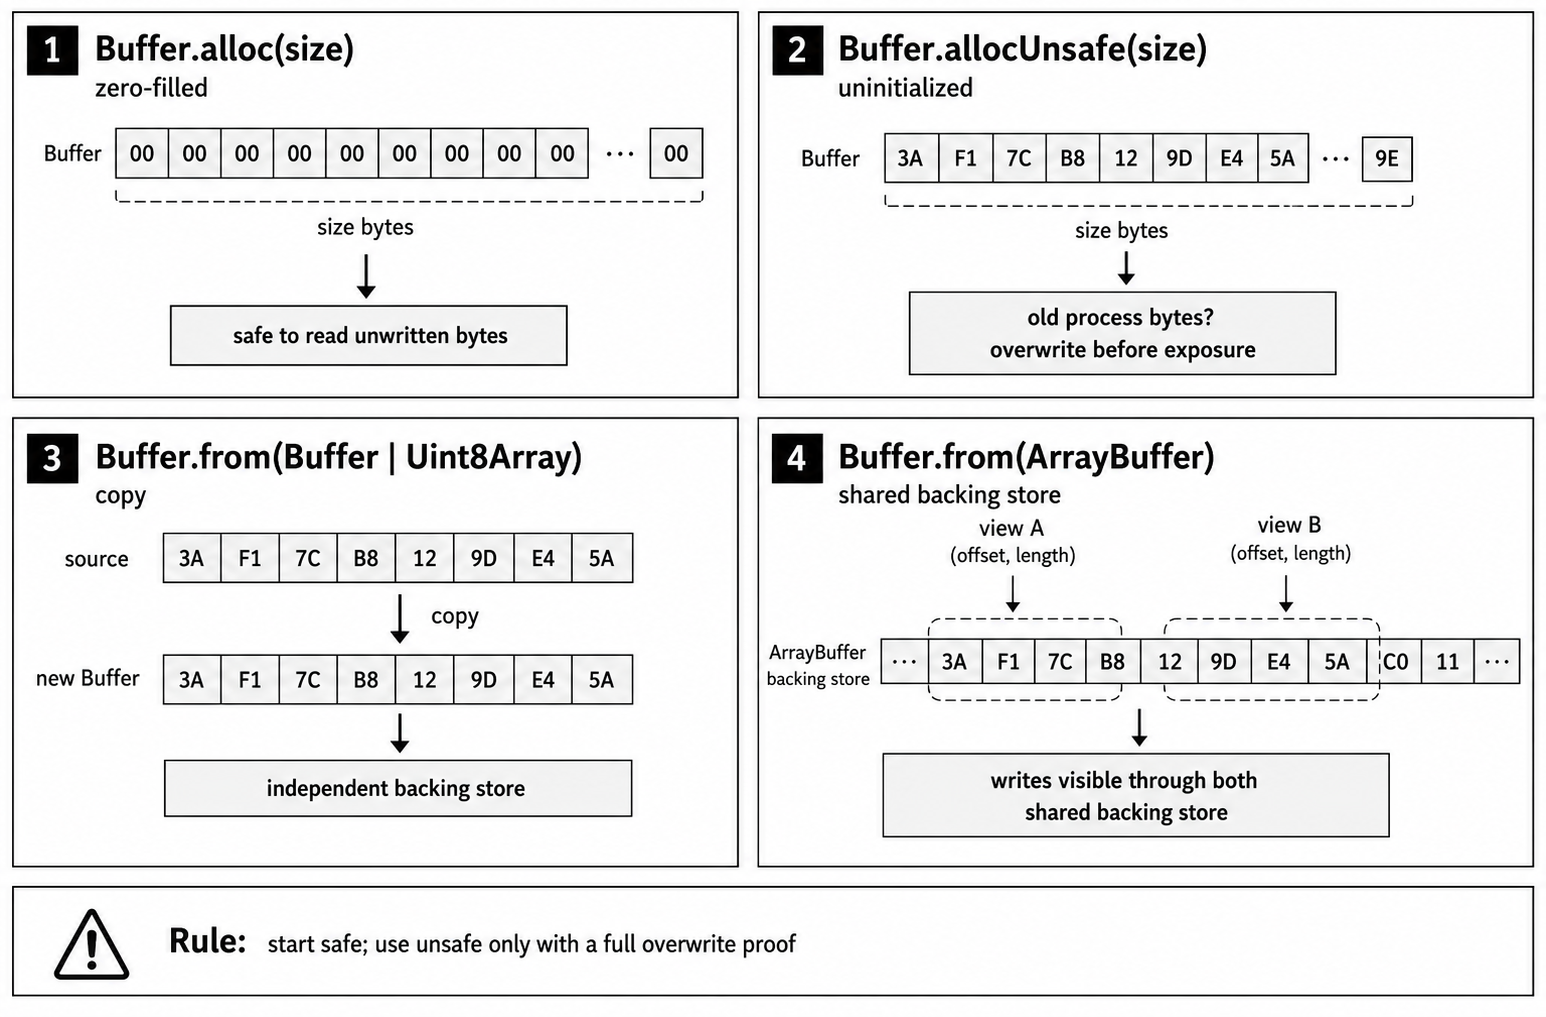
Figure 2.1 - Buffer allocation APIs differ by the state and ownership of the bytes they return: zero-filled ranges start known, unsafe ranges start unknown, copied sources become independent, and ArrayBuffer inputs can share one backing store.
How Unsafe Buffers Leak Data
Say an invoice service allocates an outbound buffer with Buffer.allocUnsafe(estimatedSize). The estimate is too large, the code writes only the valid invoice bytes, and the response sends the whole allocation -
const payloadBuffer = Buffer.allocUnsafe(estimatedSize);Here, "unsafe" does not mean the call might throw. It means the returned memory is not initialized. The Buffer may contain bytes left over from earlier work in the same process, including bytes associated with another request.
The bad estimate is only the first problem. The real bug is treating the full allocation as valid output after writing fewer bytes than the allocation length. Every undersized write into an unsafe Buffer leaves an unwritten tail, and that tail can contain whatever bytes happened to be in the reused memory.
Buffer Memory Architecture
When developers talk about memory in a Node application, they often mean the V8 heap. Ordinary JavaScript objects, strings, numbers, and functions live there, and V8's garbage collector tracks those objects until they are no longer reachable.
Buffers have two parts. The Buffer value you interact with in JavaScript is a small object on the V8 heap. The bytes it exposes are stored in backing memory accounted outside ordinary JavaScript object storage. Node's C++ core manages that backing memory so built-in modules such as fs and net can move bytes through native I/O paths without constantly converting them into strings or JavaScript arrays.
When you run const buf = Buffer.alloc(1000), Node creates a JavaScript Buffer object and associates it with a native backing store. The native allocator may reuse memory from existing arenas or request more memory from the operating system. JavaScript receives a fixed-length view over that byte range.
That separation is why Buffers are useful. Passing a Buffer around moves a small JavaScript reference, not the whole payload. Native bindings can also read from or write into the backing memory directly, while JavaScript keeps a familiar object interface.
You can see the accounting through process.memoryUsage() -
// We allocate a 50MB buffer outside the ordinary V8 heap.
const bigBuffer = Buffer.alloc(50 * 1024 * 1024);

// This shows where that memory is accounted for.
console.log(process.memoryUsage());
The output will look something like this -
{
  "rss": 39845888,
  "heapTotal": 5341184,
  "heapUsed": 3638280,
  "external": 53790468,
  "arrayBuffers": 52439315
}
Look at heapUsed compared with external. The V8 heap is only using about 3.64 MB for the script's objects, while external includes the roughly 53 MB allocated for the Buffer. arrayBuffers is the portion of that external memory used by ArrayBuffer, SharedArrayBuffer, and Buffer backing stores; it is included in external.
This is also where the danger of allocUnsafe() comes from. Ordinary JavaScript code does not receive raw, uninitialized object memory from V8. Buffer backing stores are different. Node may return backing memory without clearing it first, whether that memory comes from the internal Buffer pool or from the native allocator. Until your code overwrites it, the contents are unknown.
Native allocators and slab pools are optimized for reuse. The operating system zeroes memory before exposing it to a different process, but memory recycled inside your own process does not have to be wiped before it is handed back to your code.
Buffer.alloc()
Buffer.alloc(size) is the safe default when you need new writable memory. It does two things before JavaScript can observe the Buffer -
- It allocates backing memory for the requested byte length.
- It zero-fills that memory before the Buffer reaches JavaScript.
The second step gives the Buffer a known initial state. Every byte starts as 0x00, so reads from positions your code has not written cannot expose stale process memory. For example -
const buf = Buffer.alloc(10);

console.log(buf);
// <Buffer 00 00 00 00 00 00 00 00 00 00>
Zero-filling costs CPU because Node has to write across the allocation. For small Buffers, that cost is usually small compared with I/O, parsing, database calls, and application logic. It becomes visible when a program allocates many Buffers per second or repeatedly allocates large Buffers in a CPU-bound path.
Here is a simple allocation-and-copy pattern that can become expensive when it runs frequently -
// This runs for every incoming image chunk.
function processChunk(chunk) {
  const workBuffer = Buffer.alloc(chunk.length);
  chunk.copy(workBuffer);
  applyWatermark(workBuffer);
}
If this function runs thousands of times per second, the process pays for allocation, zero-fill, and copy on every chunk. A CPU profile may show the zero-fill path as part of the performance-critical code. That is a real trade-off, but it is still a measured performance problem, not a reason to make unsafe allocation the default.
Most application code should accept the cost. Services handling JSON APIs, database results, small protocol frames, or occasional file reads usually have larger bottlenecks elsewhere. Data-heavy paths such as video processing, packet framing, compression, image processing, and custom binary parsing deserve profiling before changing allocation policy.
If you're writing CPU/data-intensive code in Node.js, profile the workload before chasing allocation micro-optimizations. Node fits I/O-bound, event-driven workloads well, but heavy computation may belong in worker threads, native addons, WebAssembly, or a separate service.
Switching from Buffer.alloc() to Buffer.allocUnsafe() changes the security contract. It is not a harmless faster spelling.
Buffer.allocUnsafe()
Buffer.allocUnsafe(size) returns writable memory without first filling it with zeros. For small Buffers, Node may satisfy the request from an internal pool. For larger Buffers, it uses a separate backing store. Either way, the bytes are unspecified until your code writes to them.
The speed difference depends on Buffer size, Node version, platform, allocator behavior, and whether pooling is involved. Sometimes the difference is visible. Sometimes it disappears into noise. The security contract does not change: the caller must not allow unwritten bytes to be observed.
A web server handling two requests shows the failure.
Request A (User 1) -
// Handler for /update-profile
function handleUpdate(req, res) {
  const userSession = { userId: 123, role: "admin", token: "..." };
  const sessionBuffer = Buffer.from(JSON.stringify(userSession));
  // ... do something with the sessionBuffer ...
}
Request B (User 2) -
// Handler for /generate-report
function handleReport(req, res) {
  const reportBuffer = Buffer.allocUnsafe(1024);

  const reportData = generateReportData(); // returns 500 bytes
  reportData.copy(reportBuffer, 0);

  res.send(reportBuffer);
}
If Request B sends the whole reportBuffer, User 2 receives 500 bytes of valid data followed by 524 bytes of whatever was already present in the unwritten part of the Buffer. That could be harmless noise, or it could be bytes from earlier work in the same process. The exact source is allocator-dependent. The bug itself is simple: the response exposed bytes the handler did not write.
The acceptable case is narrow. The Buffer must remain private until your code has overwritten every byte that may later be observed. The fill may happen through one call, a checked loop, or an asynchronous operation, but no partial Buffer can be read, logged, returned, cached, or passed to untrusted code before that proof is complete.
A file read can meet that contract, but only if the code checks the number of bytes read and refuses to return a partial result. The file descriptor still needs normal cleanup around this pattern; the overwrite proof is in the loop -
const size = fs.fstatSync(fd).size;
const buf = Buffer.allocUnsafe(size);
let offset = 0;

while (offset < size) {
  const bytesRead = fs.readSync(fd, buf, offset, size - offset, offset);
  if (bytesRead === 0) throw new Error("Unexpected EOF");
  offset += bytesRead;
}For normal application code, fs.readFileSync() is usually simpler and safer. This example is about the narrow case where you intentionally allocate first and then prove every byte is overwritten before the Buffer can escape.
The Buffer is safe to expose only after the loop has filled every byte. fs.readSync() does not promise to fill the requested length in one call. It returns bytesRead, and short reads are possible. With an unsafe Buffer and file I/O, safety comes from checking that return value and preventing the Buffer from escaping if the read ends early.
Buffer.allocUnsafeSlow() never uses the shared internal pool. Its main use is when you need to retain a small unsafe Buffer for a long time and do not want that small slice to keep a larger pooled slab alive. It is still uninitialized memory, so it needs the same overwrite proof as allocUnsafe().
Branches, loops, and try...catch blocks are not automatically unsafe. They become unsafe when any path can expose the Buffer before the written byte count proves full initialization. Treat allocUnsafe() as a local proof obligation: reviewers should be able to see where every byte is written and where every failure path prevents the Buffer from escaping.
Buffer.from()
Buffer.from() looks like one factory, but it has several ownership behaviors. Some inputs allocate and copy. ArrayBuffer inputs create shared views. That difference affects correctness, ownership, and performance, so the source type is part of the API contract.
The common forms cover most production code.
Buffer.from(string, [encoding])
This is the usual choice when you have a string and need its binary representation. For example -
const buf = Buffer.from("hello world", "utf8");
// <Buffer 68 65 6c 6c 6f 20 77 6f 72 6c 64>
This is not a zero-cost operation. Node has to iterate through the string and encode the characters into the requested byte representation. UTF-8 is usually fast, but very large strings in a high-frequency path can show up in a CPU profile. The result is a new Buffer containing copied bytes, not a view into the JavaScript string.
Buffer.from(buffer)
Passing an existing Buffer also creates a copy. Node allocates a new Buffer of the same size and copies the full contents of the source Buffer into it -
const buf1 = Buffer.from("learn_node");
const buf2 = Buffer.from(buf1);

buf2[0] = 0x6e; // 'n'

console.log(buf1.toString()); // 'learn_node'
console.log(buf2.toString()); // 'nearn_node'
Modifying buf2 does not affect buf1. That isolation is the right ownership behavior for many APIs, but copying large Buffers still costs memory bandwidth.
Buffer.from(array)
An array of byte values is copied into a new Buffer -
const buf = Buffer.from([0x48, 0x69, 0x21]); // 'Hi!'This is handy for constants, but it is slow for large arrays. Node has to iterate the JavaScript array, check each element, and copy the value into the backing store.
Buffer.from(arrayBuffer)
The ArrayBuffer form needs more care. An ArrayBuffer is a raw binary data object in JavaScript, common in browser APIs such as fetch and FileReader and in some Node libraries. Buffer.from(arrayBuffer) creates a Buffer view that shares the same underlying memory as the ArrayBuffer. It is not a copy.
That is different from Buffer.from(typedArray), which copies the bytes from the typed array view. The difference is easy to miss because many bugs come from passing typedArray.buffer when the code really meant "copy this typed array's visible bytes."
A file upload service can run into this when a library returns the uploaded file as an ArrayBuffer. One part of the application checks the first bytes to detect the file type, while another part scans or sanitizes the whole file -
// some-upload-library gives us an ArrayBuffer
const arrayBuffer = getUploadAsArrayBuffer();

// You create a buffer to inspect the file header.
// This is a shared-memory view, not a copy.
const headerBuffer = Buffer.from(arrayBuffer, 0, 16);

// Meanwhile, another asynchronous function gets the same ArrayBuffer.
// This function sanitizes the data by overwriting certain byte patterns.
sanitizeFileInMemory(arrayBuffer);
The headerBuffer looks correct at first. You read the signature bytes and classify the file. If sanitizeFileInMemory() mutates the original arrayBuffer before the header Buffer is finished being used, the bytes visible through headerBuffer change too. There is no exception because nothing invalid happened at the memory level. Two views reference the same backing bytes, and one writer changed them.
The bug appears when code checks the header, awaits another operation, and then uses the same Buffer after another routine has mutated the shared ArrayBuffer. The Buffer did not change identity; its backing bytes changed.
There is also a byteOffset trap. A typed array can be a view over only part of a larger ArrayBuffer. If you pass view.buffer directly, the Buffer can cover bytes outside the view you intended to use -
const arrayBuffer = new ArrayBuffer(2048);
const view = new Uint8Array(arrayBuffer, 1024, 16);

const wrong = Buffer.from(view.buffer); // whole ArrayBuffer
const sharedView = Buffer.from(view.buffer, view.byteOffset, view.byteLength);
const copy = Buffer.from(view); // copied 16 bytes
When the ArrayBuffer comes from an external source and you need stable bytes, make the copy explicit -
const arrayBuffer = getUploadAsArrayBuffer();

const headerBuffer = Buffer.alloc(16);
const sourceView = Buffer.from(arrayBuffer, 0, 16);
sourceView.copy(headerBuffer);

sanitizeFileInMemory(arrayBuffer);
After the copy, headerBuffer is decoupled from the original arrayBuffer. Later writes through the original memory cannot change the bytes you already copied.
Buffer Pooling and the 4096-Byte Cutoff
allocUnsafe() can return memory with old bytes in it. Usually those bytes are not from another process. They are memory recycled inside your own process, either from Node's Buffer slab pool or from the native allocator.
The pool exists because constantly asking the native allocator for small chunks is inefficient. Node maintains an internal Buffer pool with a default size of 8 KiB (Buffer.poolSize). In Node v24.15, Buffer.allocUnsafe(), Buffer.from(string), Buffer.from(array), and Buffer.concat() may allocate from the shared internal pool when size < (Buffer.poolSize >>> 1). With the default pool size, requests up to 4095 bytes are pool-eligible; exactly 4096 bytes is not.
That difference explains performance and retention behavior, but it is an implementation detail, not a correctness rule. Application safety must not depend on whether a particular allocation came from a slab or from a separate backing store.
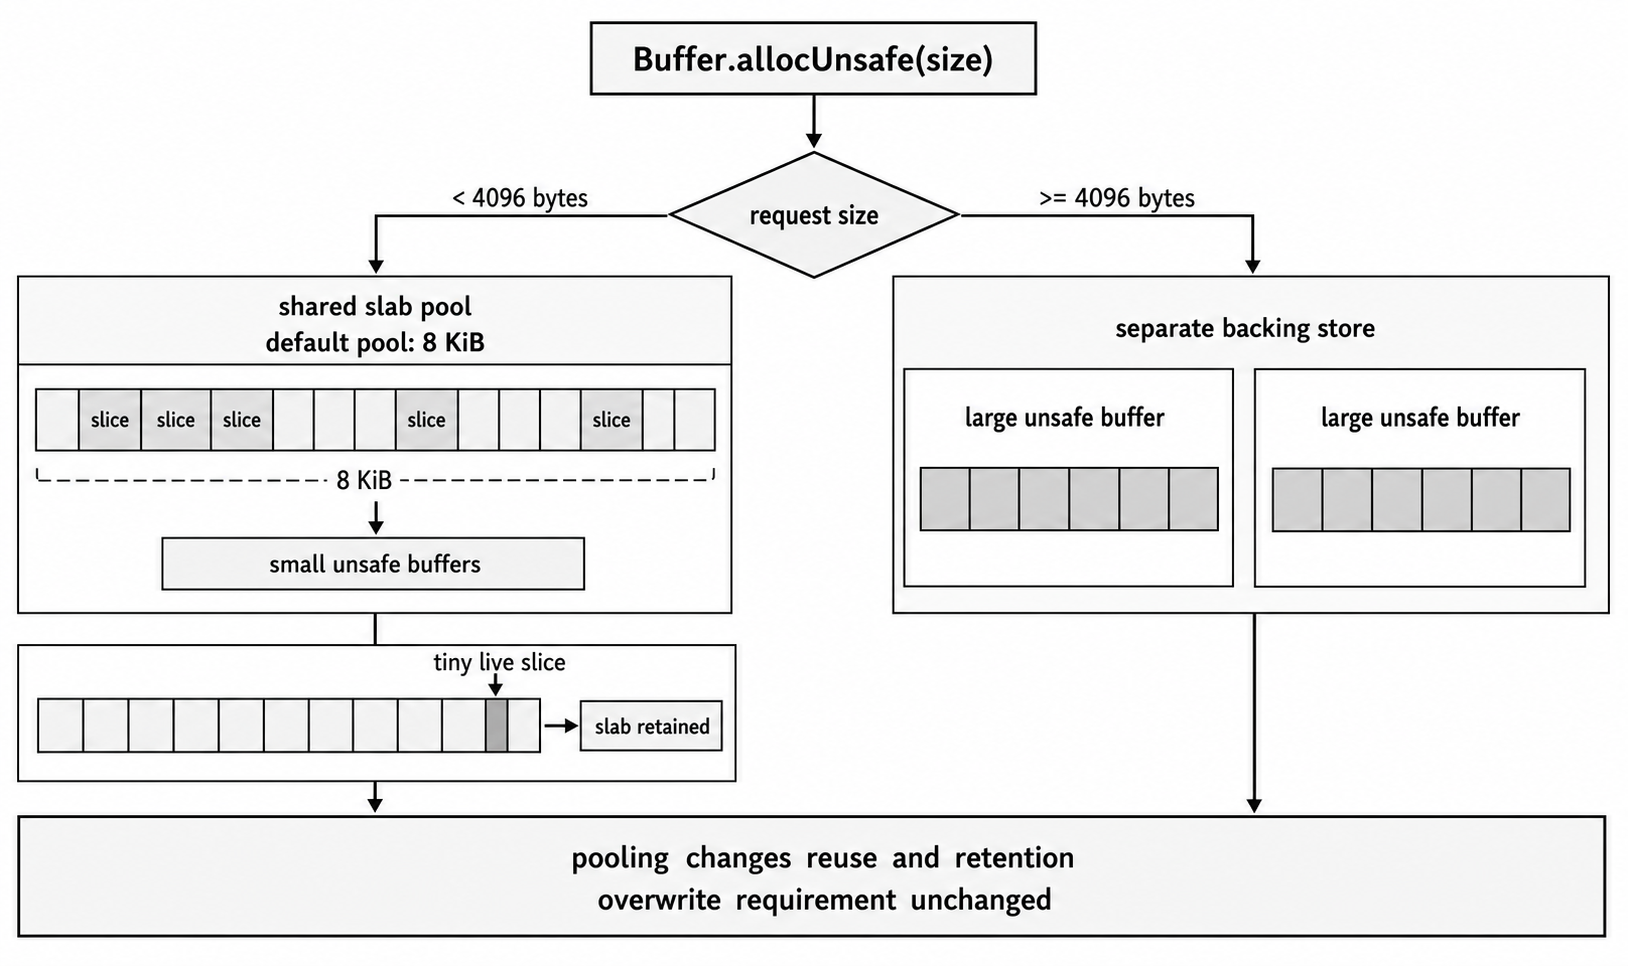
Figure 2.2 - Small pool-eligible unsafe allocations can be carved from one slab, while larger allocations receive separate backing stores. The pooling cutoff affects churn and retention, but it does not change the overwrite requirement.
Buffer.alloc() is the exception worth remembering: it does not use the shared internal pool. If you need a zero-filled Buffer, it allocates initialized memory directly. Buffer.allocUnsafe(size).fill(0) can still use the pool for eligible sizes, but then your code has taken responsibility for the fill step.
When you call Buffer.allocUnsafe(100), Node may return a Buffer that points at a 100-byte slice of the shared slab. That does not mean Node keeps a precise per-slice free list that immediately hands the same 100-byte region to the next request. The contract you can rely on is simpler: small unsafe Buffers may share a larger backing slab, and unsafe allocations may expose stale bytes until you overwrite them.
If an application writes sensitive data into Buffers, those bytes can remain in process memory after the original JavaScript objects become unreachable. Later unsafe allocations are allowed to show whatever bytes happen to be in the memory they receive. That is enough to make partially written unsafe Buffers dangerous without assuming the pool behaves like a deterministic cache of secrets.
Pooling has a retention trade-off too. A tiny pooled Buffer can keep its larger slab alive while the tiny slice is still referenced. If you intentionally need to keep a small unsafe allocation for a long time, Buffer.allocUnsafeSlow() avoids the shared pool. It does not make the memory safe; it only changes where the backing memory comes from.
The default Buffer.poolSize exists for a reason. Changing it is rarely the right optimization. If you are considering it, use benchmark evidence from the workload you are actually running.
Allocation Performance
Microbenchmarks cannot tell you what to do in production, but they can show the shape of the trade-off. The performance difference between alloc and allocUnsafe can be large enough to show up in performance-critical paths, especially when allocation is repeated many times or the Buffer is large.
The benchmark below allocates a Buffer of a specific size 10,000 times and measures elapsed time. It discards each allocation immediately, so it isolates allocation cost rather than modeling request latency, memory retention, or garbage-collection behavior. It also prints the Node version and platform because the numbers are environment-specific -
const { Buffer } = require("node:buffer");
const { performance } = require("node:perf_hooks");

const ITERATIONS = 10000;
const largeSize = 1024 * 1024;
The helper keeps the benchmark focused on allocation cost -
function benchmark(name, size, allocFn) {
  const start = performance.now();
  for (let i = 0; i < ITERATIONS; i++) allocFn(size);
  const duration = (performance.now() - start).toFixed(2);
  console.log(`- ${name}(${size}) x ${ITERATIONS}: ${duration}ms`);
}
Print the environment with the numbers so runs can be compared honestly -
console.log({
  iterations: ITERATIONS,
  node: process.version,
  platform: process.platform,
  arch: process.arch,
  poolSize: Buffer.poolSize,
  pooledLimit: Buffer.poolSize >>> 1,
});
Then run the same allocation pattern at three sizes -
benchmark("Buffer.alloc", 100, (s) => Buffer.alloc(s));
benchmark("Buffer.allocUnsafe", 100, (s) => Buffer.allocUnsafe(s));

const mediumSize = 10 * 1024;
benchmark("Buffer.alloc", mediumSize, (s) => Buffer.alloc(s));
benchmark("Buffer.allocUnsafe", mediumSize, (s) => Buffer.allocUnsafe(s));

benchmark("Buffer.alloc", largeSize, (s) => Buffer.alloc(s));
benchmark("Buffer.allocUnsafe", largeSize, (s) => Buffer.allocUnsafe(s));
The same file can measure a couple of Buffer.from() cases -
const largeString = "a".repeat(largeSize);
const existingLargeBuffer = Buffer.alloc(largeSize);

function once(name, fn) {
  const start = performance.now();
  fn();
  console.log(`- ${name}: ${(performance.now() - start).toFixed(2)}ms`);
}

once("Buffer.from(1MB string)", () => Buffer.from(largeString, "utf8"));
once("Buffer.from(1MB buffer, copy)", () => Buffer.from(existingLargeBuffer));
Scenario 1 - Small Allocations (100 bytes)
This is the case where Buffer.allocUnsafe() is eligible for the internal pool. Buffer.alloc() still returns initialized memory and does not use that shared pool.
Example output from one run on Node.js v24.15, Linux x64 -
- Buffer.alloc(100) x 10000: 8.60ms
- Buffer.allocUnsafe(100) x 10000: 5.61ms
Here, allocUnsafe was faster in this run. The absolute difference is tiny; the useful question is whether this allocation runs often enough for the difference to show up in a profile.
Scenario 2 - Medium Allocations (10 KiB)
This is above the default pool threshold. Pooling is no longer the explanation for the result.
One run produced -
- Buffer.alloc(10240) x 10000: 36.53ms
- Buffer.allocUnsafe(10240) x 10000: 16.35ms
On this system, allocUnsafe was faster for 10 KiB Buffers. On another system, with another allocator and a different Node build, the ratio can change. This is why the benchmark prints the environment and why the production rule remains the same: profile the real workload.
Scenario 3 - Large Allocations (1 MiB)
This is the size range you may see in file uploads, video streams, or other large binary data.
One run produced -
- Buffer.alloc(1048576) x 10000: 1441.23ms
- Buffer.allocUnsafe(1048576) x 10000: 134.55ms
In this run, the large-Buffer difference is substantial because Buffer.alloc() has to write zeros across each 1 MiB allocation. Do not translate the total loop time directly into request latency; this benchmark isolates allocation cost by doing the same operation repeatedly.
When a profiler shows that Buffer.alloc() consumes 80% of CPU time, even a 1.2x speedup can be tempting. The cost is not only CPU behavior. It is the new requirement to prove initialization before observation.
Buffer.from() Performance
Buffer.from() performance depends on the source.
Example output -
- Buffer.from(1MB string): 1.17ms
- Buffer.from(1MB buffer, copy): 0.51ms
Creating a 1 MiB Buffer from a 1 MiB string took about 1.17ms in this run. This is the cost of UTF-8 encoding and copying.
Copying an existing 1 MiB Buffer took about 0.51ms. This is a highly optimized memory copy, but it is still a cost to be aware of if you are doing it in a loop.
These numbers give you a model for making decisions. Small allocations may have negligible differences. Large allocations can make zero-filling visible. Allocations on paths that run thousands of times per second can turn tiny differences into real CPU time. The only way to know is to profile your application under realistic load. Measure the bottleneck first, then use allocation benchmarks to understand the trade-off you are actually considering.
Security Implications and Attack Vectors
The main security failure is direct information disclosure through uninitialized memory from allocUnsafe(). Two related patterns need attention in review: cryptographic material that may live in process memory, and attacker-controlled input that forces large Buffer allocation.
Direct Information Disclosure
This is the allocUnsafe() scenario from earlier sections. An attacker receives a response, a file, or an error log containing data from another user or from the system itself. The leaked data can include -
- Session tokens, API keys, JWTs
- Passwords, password hashes, or salts in transit
- Database credentials or connection strings
- PII (personally identifiable information) like names, emails, addresses
- Encryption keys
- Fragments of TLS certificates or private keys
The vulnerable shape is any Buffer.allocUnsafe(size) call followed by logic that fails to overwrite the entire Buffer before it can be observed. Incorrect size calculations, early return paths, and optimistic try...catch blocks can all leave a partially filled Buffer exposed.
Cryptographic Material in Process Memory
If an application handles encryption or decryption, keys, nonces, plaintext, ciphertext, or derived material may exist in Buffers, ArrayBuffers, native structures, or KeyObject storage depending on the API. Unsafe Buffer allocation does not make private-key leakage predictable, but it does make stale process bytes observable when application code exposes unwritten memory. The safe claim is narrower and still serious: cryptographic material is another class of data that should never depend on allocator luck.
Denial of Service (DoS) via Buffer.from()
Allocation safety is not only about stale bytes. An API endpoint may accept a JSON payload where one field is expected to be a base64-encoded string that becomes a Buffer.
A vulnerable version looks like this -
// Attacker sends: { "data": "very...long...string" }
const body = JSON.parse(req.body);

// The server decodes and allocates based on attacker input.
const dataBuffer = Buffer.from(body.data, "base64");
The Buffer.from() call with base64 input allocates a new Buffer based on the decoded size of the string. Base64 does not expand when decoded; the decoded bytes are usually about three quarters of the encoded string length, with padding and whitespace affecting exact values. The DoS risk remains because the attacker controls a string that may be very large, and decoding it forces the process to allocate memory for the decoded bytes.
Put the limit before the decode -
const MAX_BASE64_CHARS = 2 * 1024 * 1024;
const body = JSON.parse(req.body);

if (typeof body.data !== "string" || body.data.length > MAX_BASE64_CHARS) {
  throw new Error("payload too large");
}

const dataBuffer = Buffer.from(body.data, "base64");
The exact limit should come from your API contract and request body limit. The order is the point: reject oversized encoded input before Buffer.from() allocates decoded storage.
The primary defense is to treat any data coming from an allocUnsafe() Buffer as untrusted until your code has overwritten it. Code reviews should challenge every allocUnsafe() call with one question: can this Buffer be observed before all bytes that may be observed have been written? If the answer is not clearly no, use Buffer.alloc().
For small allocations that come from Node's internal pool, allocUnsafe() is very fast: essentially slicing from an existing slab. If the pool is exhausted, a new slab or separate allocation is required and costs increase. allocUnsafeSlow() does not use the pool. The time is not "constant for all sizes"; behavior changes when the request crosses pooling and allocator edges.
Node can be started with --zero-fill-buffers to force newly allocated Buffer instances to be zero-filled, including Buffers created by Buffer.allocUnsafe() and Buffer.allocUnsafeSlow(). This can be useful as a defense-in-depth option for sensitive processes, but Node documents a measurable performance cost. Treat it as a runtime policy guard, not as permission to relax unsafe-Buffer review.
Memory Fragmentation and GC Pressure
If profiling keeps pushing an application toward Buffer.allocUnsafe() for performance, first confirm the bottleneck carefully. The problem may be allocation churn, unnecessary copies, or CPU-bound binary processing rather than zero-fill alone.
For CPU-heavy work such as image processing, compression, transcoding, and large cryptographic batches, consider moving the performance-critical path to worker threads, a native addon, WebAssembly, or a separate service written in a language better suited to that workload. Keep Node where it fits: I/O coordination, application logic, and service interfaces.
The same allocation choices that affect security also affect memory usage and garbage-collector behavior.
Garbage Collector Pressure
Every Buffer object you create, however large its external storage is, has a small corresponding object on the V8 heap. When code creates and discards thousands of Buffers per second, it creates churn for the V8 garbage collector. The GC still has to track those small heap objects, determine when they are no longer reachable, and clean them up.
That overhead is usually minor for the Buffer wrappers themselves, but it often appears alongside a larger problem: temporary copies. A streaming parser can accidentally create that pattern with repeated concatenation -
let internalBuffer = Buffer.alloc(0);

function handleData(chunk) {
  internalBuffer = Buffer.concat([internalBuffer, chunk]);
  // ... try to parse messages from internalBuffer ...
}
Buffer.concat() is convenient, but it allocates a new Buffer large enough to hold both internalBuffer and chunk, copies the data from both into the new Buffer, and then discards the old ones. If 100 small chunks form one message, the parser performs 100 allocations and 99 copy operations, creating and immediately discarding 99 intermediate Buffers. A better parser usually manages a larger Buffer and an offset, but stream parser design belongs later. The point here is that allocation strategy is as important as the allocation function.
Memory Fragmentation
The next chapter is dedicated entirely to Memory Fragmentation. I'll do a gentle introduction here, but don't worry if something doesn't makes sense yet.
Fragmentation becomes more visible with Buffers outside the small-buffer pool. With the default Buffer.poolSize, allocUnsafe() and some Buffer.from() forms are pool-eligible only below 4096 bytes in Node v24.15. A long-running application that frequently allocates and frees larger Buffers of varying sizes can end up with free regions that do not match future allocation sizes well.
A simplified allocation sequence shows the issue -
- You allocate a 1MB Buffer, Block A.
- You allocate a 2MB Buffer, Block B.
- You allocate another 1MB Buffer, Block C. The contiguous region now has
[A:1MB][B:2MB][C:1MB]. - You free the 2MB Buffer in the middle, Block B. The region now has
[A:1MB][---EMPTY:2MB---][C:1MB].
After step four, the process has a 2 MiB free region. If the next request needs a 3 MiB Buffer, that region cannot satisfy it. The allocator must find another suitable span, request more memory, or fail if process or container limits prevent that. This is fragmentation: total reusable memory and suitably shaped reusable memory are not the same thing.
Over time, a long-running Node process can accumulate many such free gaps. Overall memory usage, reported as rss or Resident Set Size, may rise even when active memory, such as heapUsed plus external, looks stable. That can happen because the C++ memory allocator, usually malloc or a related allocator, cannot always reuse fragmented free regions efficiently.
Frequent large, variable-sized Buffer backing-store allocations are a primary fragmentation risk. Buffer.alloc(), Buffer.allocUnsafe(), Buffer.from(), and Buffer.concat() can all create large backing stores. Zero-fill cost is only one part of the problem; allocation size and lifetime patterns drive fragmentation.
Buffer pooling is a direct defense against fragmentation for small allocations. By reusing a slab of memory for many small Buffers, Node avoids creating thousands of tiny native allocations and deallocations. This is one of the pool's main benefits.
If a service deals with large binary blobs and rss grows over time without a corresponding increase in heapUsed or external, fragmentation may be involved. The solution is often to move to a more deliberate memory management strategy: allocate a few very large "arena" Buffers at startup and manage regions inside them yourself instead of constantly asking Node for new large Buffers. This is an advanced technique, but it follows naturally when default allocation patterns break down at extreme scale.
Platform Differences and Allocator Behavior
Node provides a useful abstraction over the operating system, but it does not remove platform behavior. Performance and the exact contents of uninitialized memory can vary with the platform underneath the runtime.
The function Node ultimately calls to get memory from the OS is typically malloc or a variant of it. The implementation can differ between operating systems such as Linux, macOS, and Windows, and between C standard library implementations such as glibc, musl, and jemalloc.
What you see in a Buffer.allocUnsafe() Buffer depends on the OS and the allocator's strategy. Some allocators may be more likely to give you freshly zeroed memory from the OS for a large block, while others may be more aggressive about recycling memory from your own process. The security risk is always present, but the specific data you might leak can change between a developer's macOS machine and a production Linux or Alpine container. Never assume that a vulnerability does not exist because sensitive data does not appear in a test environment.
The relative difference between alloc() and allocUnsafe() is not fixed. It varies by size, platform, allocator, Node version, and whether the request uses the Buffer pool. An allocator like jemalloc is heavily optimized for multi-threaded allocation and reducing fragmentation. A Node binary compiled against jemalloc might show different performance profiles for heavy allocation workloads than one using the system's default glibc malloc. This is usually micro-optimization territory, but for very large services, it can count.
Node's internal Buffer pool sits on top of the system allocator. The default slab size is 8 KiB (Buffer.poolSize), and how the system deals with those allocations can differ across platforms.
You do not need to become an expert in system memory allocators to write safe Buffer code. You do need to avoid relying on local allocator behavior. The predictable environment on your development machine is not a perfect copy of production. A memory-layout bug can be hard to reproduce locally and still be exploitable under production traffic patterns.
The portable contract is the only safe one: allocUnsafe() returns uninitialized memory, and your code is responsible for clearing or overwriting every byte that can be observed. The specific contents of that memory can change across platforms and runs.
Production Decision Framework
Use allocation APIs as explicit contracts during implementation and review. The framework is intentionally conservative because the failure mode for a bad unsafe allocation is data exposure.
Default
For new writable memory, choose Buffer.alloc(size). Correctness and security come first, and in most application code the zero-fill cost is not worth changing until profiling proves otherwise. Network latency, disk I/O, database query time, and application logic often dominate. Using allocUnsafe() in those paths is premature optimization with security risk.
Evidence
Do not deviate from the default unless you have proof that this allocation is a performance bottleneck. Proof means a CPU profile from a tool such as 0x, Node's built-in profiler, or a production APM tool that shows meaningful time spent in Buffer.alloc() on the line you are considering changing.
Guesses, feelings, and "this might be faster" are not evidence.
Unsafe Exception
If a profile shows Buffer.alloc() dominating CPU time and causing real service impact, you can consider Buffer.allocUnsafe(). The review question is precise -
Question - Can this Buffer be observed before every byte that may be observed has been overwritten?
The overwrite can be a direct fill(), a copy whose length is checked, a loop around fs.readSync(), or a private async operation. The safety condition is not "no loops." The safety condition is that no path exposes a partially initialized Buffer, and every short write, short read, or thrown error prevents the Buffer from escaping.
| Pattern | Review result |
|---|---|
fs.readSync(fd, buf, ...) in a loop that reads the expected byte count and throws before exposing the Buffer on short read | Good candidate |
buf.fill(someValue) immediately after allocation | Good candidate |
| A 1024-byte Buffer where a loop might write only 500 bytes depending on input | Bad candidate |
A try...catch path that logs or returns the partially filled Buffer | Bad candidate |
If you cannot prove the overwrite, allocUnsafe() is not the solution. The fix may be to reduce allocations, use streams, pre-allocate a work Buffer with clear ownership, or change the algorithm.
Buffer.from() Source
The decision is based on the source data. If you are creating a Buffer from a string, an array, or another Buffer, Buffer.from() is usually the right API, with the ordinary cost of transcoding or copying. If the source is an ArrayBuffer or other external memory you do not control, be cautious. Buffer.from(arrayBuffer) creates a shared-memory view. If you need bytes that cannot change later, make an explicit copy. If you are starting from a typed array view, remember that view.buffer may be larger than the view. Pass view.byteOffset and view.byteLength for a shared view of the intended range, or use Buffer.from(view) for a copy.
This framework turns unsafe Buffer usage into a narrow, reviewable exception instead of a casual habit.
Migration Patterns and Safer Defaults
In a legacy codebase, start with a mechanical audit for deprecated and unsafe Buffer APIs.
A simple grep, rg, or editor-wide search is enough to find the first pass of dangerous patterns.
Search for new Buffer(). This is the old, deprecated constructor. It was error-prone because behavior changed depending on the argument type. Its behavior combines parts of allocUnsafe(), alloc(), and from(), which makes reviews harder than they need to be. Every instance of new Buffer() should be removed. Current Node.js environments may issue a runtime deprecation warning for application code that uses it.
Search for Buffer.allocUnsafe. For every result, apply the Production Decision Framework from the previous section.
- Is there profiler output justifying its use? Probably not.
- If so, is it followed by an unconditional, complete overwrite?
- If the answer to either question is no, replace it.
The migration path is usually straightforward.
Replace new Buffer(number) with Buffer.alloc(number). Before Node.js 8.0, the numeric constructor returned uninitialized memory. Current Node.js releases zero-fill new Buffer(number), but the constructor is still deprecated and still ambiguous. The clear modern equivalent is Buffer.alloc(number) -
// BEFORE - Deprecated, historically unsafe, and ambiguous.
const unsafeBuf = new Buffer(1024);

// AFTER - Safe, zero-filled buffer.
const safeBuf = Buffer.alloc(1024);
Replace Buffer.allocUnsafe(size) with Buffer.alloc(size) when an unsafe allocation cannot be proven safe. This may have a performance impact. If the regression is unacceptable, the next step is to reduce allocation churn, use streams, pre-allocate with clear ownership, or change the algorithm. Keeping the unsafe version without an overwrite proof is not the fix.
Replace new Buffer(string) with Buffer.from(string), since the old constructor could also take a string. Use the explicit modern form -
// BEFORE - Deprecated and less explicit.
const oldWay = new Buffer("hello", "utf8");

// AFTER - Modern, clear, and correct.
const newWay = Buffer.from("hello", "utf8");
Auditing once is useful, but preventing new problems is better. Prefer eslint-plugin-n in new ESLint projects. It is the maintained fork of eslint-plugin-node and includes n/no-deprecated-api.
The rule n/no-deprecated-api flags deprecated Node APIs such as new Buffer(), preventing anyone from reintroducing it. Older projects may still use eslint-plugin-node and its legacy node/no-deprecated-api rule, but new configuration should use the n/ rule name.
For more advanced protection, you can write a custom ESLint rule that flags all uses of Buffer.allocUnsafe. Then use // eslint-disable-next-line comments on the few carefully vetted lines where its use is justified. That forces each unsafe allocation to carry a local explanation and makes it stand out during code review.
The goal is to make the safe path ordinary and the unsafe path visibly exceptional.
Code Review Rules
Use these rules when reviewing Buffer allocation code.
-
Default to
Buffer.alloc()when you need new writable memory. It is predictable, secure, and fast enough for most application code. -
Treat
Buffer.allocUnsafe()as a measured exception. Use it only when profiling shows allocation cost is meaningful and the overwrite proof is obvious in the surrounding code. -
Keep unsafe Buffers private until fully initialized. The fill can happen through a checked loop or private async operation, but no code path may read, log, send, cache, or expose the Buffer before the written byte count proves it is safe.
-
Immediately remove and replace all instances of the deprecated
new Buffer()constructor. It is ambiguous, historically unsafe for numeric arguments before Node.js 8, and replaced by explicit APIs:Buffer.alloc(),Buffer.allocUnsafe(), andBuffer.from(). -
Be suspicious of
Buffer.from()withArrayBuffers. When receiving anArrayBufferfrom an external source, assume it creates a shared-memory view. If you need a stable, immutable copy, create it explicitly withBuffer.alloc(size)and.copy(). -
Lint for unsafe patterns. Use
eslint-plugin-nandn/no-deprecated-apito catch deprecated Node APIs. Consider a custom rule forBuffer.allocUnsafeso every exception needs a local justification. -
Avoid allocation-heavy patterns in high-frequency paths. Creating many small, short-lived Buffers in a tight loop, such as repeated
Buffer.concat()calls, can increase garbage-collector work and waste CPU on copying. Look for ways to use streams or pre-allocate a single larger Buffer to reduce allocation churn. -
Comment dangerous code. If you have a legitimate, benchmark-proven reason to use
Buffer.allocUnsafe, leave a detailed comment explaining why. Link to the benchmark data or profiler output. The next developer, which might be you in six months, needs to understand the risk and the justification.
For example -
// Profiling showed Buffer.alloc consuming 30% of CPU under load.
// This buffer is returned only after fileSize bytes are read.
const buf = Buffer.allocUnsafe(fileSize);
let offset = 0;

while (offset < fileSize) {
  const bytesRead = fs.readSync(fd, buf, offset, fileSize - offset, offset);
  if (bytesRead === 0) throw new Error("Unexpected EOF");
  offset += bytesRead;
}
Unsafe Allocation as a Review Edge
The choice between alloc(), allocUnsafe(), and from() is about matching the function's contract to the code that receives the bytes. The default should be conservative: allocate initialized memory, copy when ownership is needed, and only share backing memory when that sharing is intentional.
Use the safe API by default, measure before optimizing, and treat every unsafe allocation as code that needs proof.