Node.js Process Lifecycle: Normal Behavior, Startup, Signals, and Shutdown
This chapter is a long read. Grab something to eat while your brain buffers all this amazing information!
The lifecycle of a Node.js process actually gets to work long before your entry file even touches the disk. When you run the node command, the executable has to tackle a lot of heavy lifting first. It parses your CLI flags, spins up V8, creates a memory isolate and context, initializes libuv, registers native modules, runs its own internal bootstrap JavaScript, and then finally loads your entry module. Phew, that was too much to read in one go.
Only after this entire native setup finishes does your actual code start running. From that point on, the process stays alive only if there are active, referenced resources - like open sockets, running timers, active database requests, workers, or child processes - keeping the event loop busy.
I recommend you to go through the previous chapter - Node.js Evnet Loop before going further in this chapter.
This lifecycle runs straight through startup, everyday steady-state work, and eventual shutdown, passing state around via the global process object and its underlying native handles. Little details here can completely break orchestration if you aren't careful.
For instance, a bloated or slow require() path can stall your app's startup readiness, while a forgotten, active timer can accidentally keep your process from ever exiting. Out in production, missing a proper SIGTERM signal handler means platforms like Kubernetes or systemd will lose patience and violently kill your container once its grace period runs out. Similarly, when an uncaught exception hits, your application's state becomes completely compromised, meaning your error handler needs to quickly log the issue, trigger a graceful shutdown, and let the process die.
You should definitely know how all of this connects for building reliable services. It means you understand exactly what happens before your code boots up, how module loading impacts your startup time, which handles are keeping your app awake, how system signals dictate exit behaviors, and how to safely drain in-flight work before shutting down.
In further chapters, we'll talk about how application-visible runtime state is exposed through the process object. Signal delivery, exit status, and graceful termination deadlines are discussed in Signals and Exit Codes.
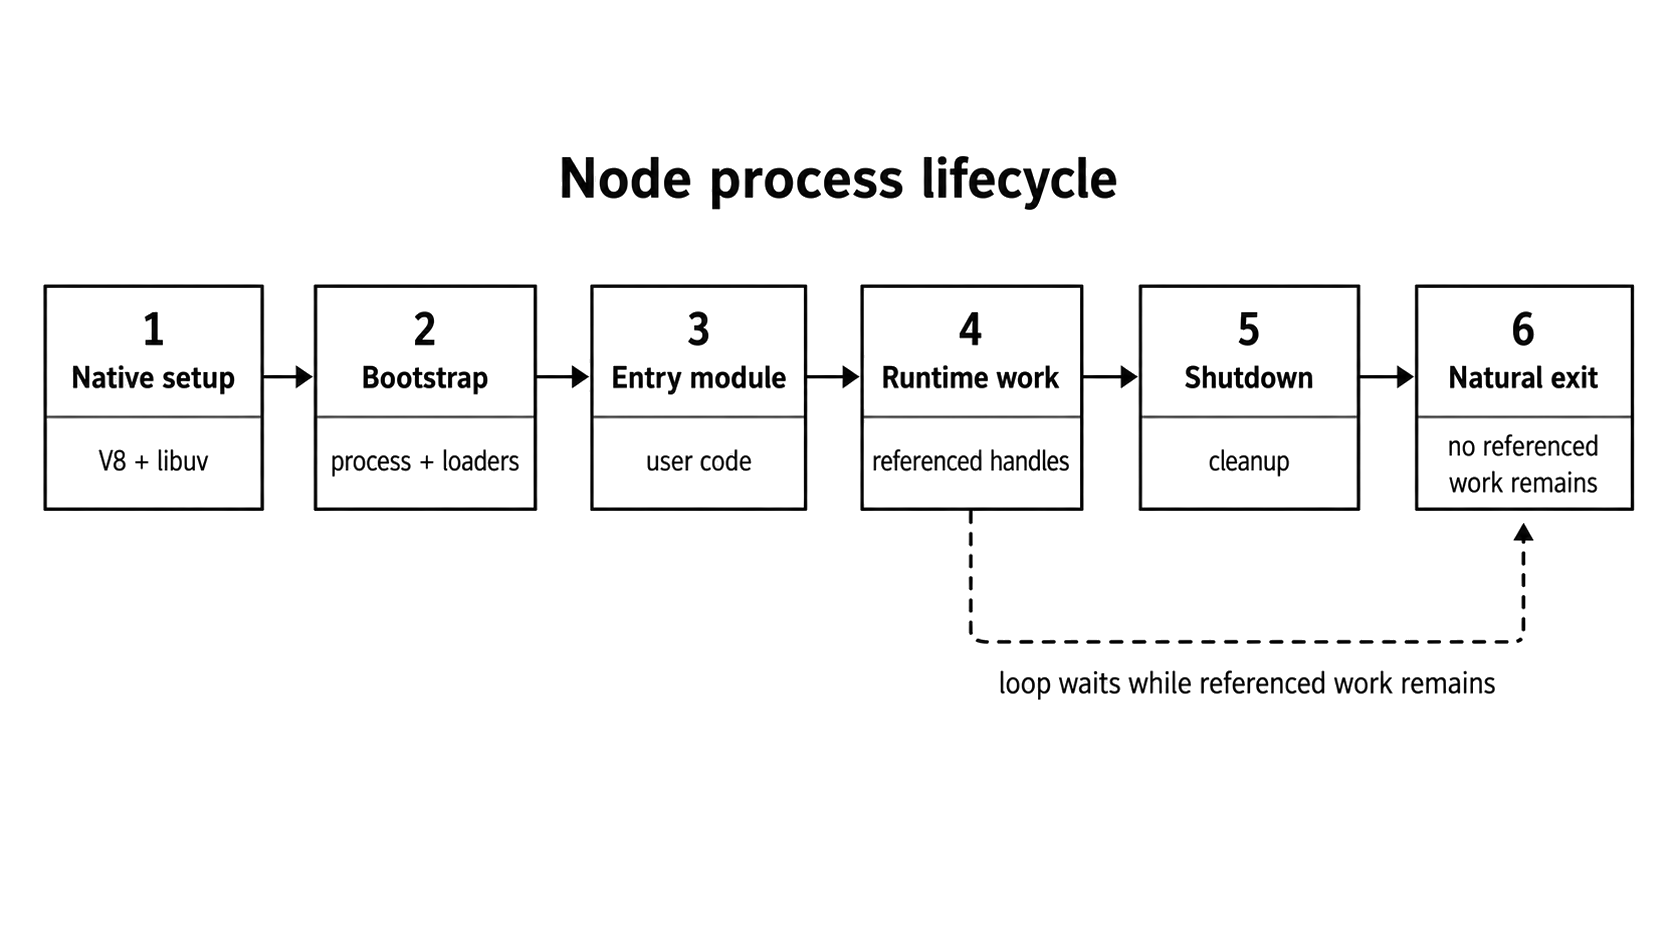
Figure 1.1 - A Node.js process starts in native runtime setup, enters user code, stays alive while referenced work remains, and exits only after shutdown leaves the event loop without required work.
This chapter focuses specifically on Node v24 behavior. If an API behaves differently across versions, I will call that out directly in the text.
Normal Node.js Process Behavior
A standard Node.js process moves through four main stages - native startup, entry-module evaluation, steady-state execution, and finally, shutdown. Shutdown handles clearing out any remaining resources and leaving behind an exit code, which is useful for your container supervisor or parent process.
The part that usually confuses most devs is the massive gap between "the main file finished running" and "the process actually exited." No, your app doesn't just stop when it hits the last line of your main script. The entry module can completely finish its execution while leaving the event loop packed with active work. Things like an open server socket, a pending request, a running interval, a worker thread, a child process, or an open data stream will all keep the process alive long after your top-level code is done.
Take a look at this example -
setTimeout(() => console.log("still alive"), 1_000);
console.log("entry module done");
The top-level log prints immediately. Because that timer handle is referenced by default, the process stays completely alive waiting for the clock to run down. Only after that timer callback fires and finishes can Node safely exit - assuming there isn't any other referenced work waiting around.
You might not know this but you can change this behavior using unref() -
const timer = setInterval(() => {}, 1_000);
timer.unref();
console.log("entry module done");
Even though the interval is still technically active here, calling unref() tells Node to treat it purely as background work. This means Node is free to shut down the exact moment all other major referenced work is done, completely ignoring this active interval.
At the end of the day, a process stays alive based on the status of its active resources, not the sequential order of your source code. Node will only exit when it has absolutely zero referenced handles or active requests left to keep the event loop spinning.
A simple script with no leftover background tasks wraps up and stops almost instantly. On the flip side, a service with an open HTTP server, a database connection pool, active workers, or live sockets will keep running indefinitely until those specific resources are explicitly closed or unreferenced.
What is normal Node.js process behavior during development?
When you are working locally, your Node.js process rarely runs alone. Development tools - like watch mode, test runners, debuggers, and process managers - keep on wrapping extra state around your application. These tools keep their own file watchers, open sockets, active timers, and child processes running in the background. Because of this, the entire process might stay completely alive and refuse to exit even after your own code has finished running.
node --watch server.jsTake the built-in watch mode, for example, it keeps an active eye on your filesystem and restarts your application whenever a file changes. Framework development servers do something similar, often keeping an HTTP server or an extra child process alive behind the scenes.
If your process exit behavior ever looks strange, don't waste time guessing what the event loop is doing. Instead, compare your development command against a plain, vanilla node server.js run. If the plain version exits normally, you know not to blame your application logic - the issue is likely in the development tooling itself. From there, you can inspect the active resources directly inside the process to see exactly which handles are holding the door open.
Process Startup Sequence
Before any of your actual application code gets to run, Node has to kick off a massive native bootstrap sequence under the hood. It sets up V8, hooks into libuv, links core bindings, spins up the process object, and readies the module loader.
While the exact internal call path is slightly different across different versions of Node, the source-level entry points for Node v24 start in node_main.cc, handle environment setup in node.cc, and then hand off control to internal bootstrap JavaScript.
At a high level, you can think of the native entry point moving through this exact sequence. It's going to be long, but you don't have to memorize it.
- The main function starts by parsing your command-line options - like
--inspector--max-old-space-size- and establishing the baseline state for the entire process. - Node initializes the V8 platform next, setting up engine-wide services across the system.
- V8 creates an isolate, which acts as a completely separate, dedicated instance of the runtime that owns its own JavaScript heap, garbage collector state, and execution machinery.
- A V8 context is built inside that isolate, serving as the actual workspace where the global object and standard built-ins like
Object,Array, andJSONlive. - The libuv event loop initializes, meaning the loop logic is officially alive and ready even though your user callbacks aren't running just yet.
- The libuv worker pool spins up to handle async tasks that need background threads - that we talked about previously - like file-system work,
dns.lookup(), or crypto operations - while synchronous methods likefs.readFileSync()still directly block the main thread. - The
node::Environmentobject is created to hook everything up together, bridging the V8 isolate, context, event loop, native bindings, and process state into a single cohesive package. - Core and native modules register themselves behind the scenes so they can be easily exposed later whenever your code calls
require()orimport. - Internal bootstrap JavaScript runs to assemble user-facing runtime objects like
process, wire up the module loading system, and prep the environment for your files. - Your entry module resolves, loads, and executes, finally handing execution control over to the actual application code you wrote.
Here is how that startup funnel looks in action:

Figure 1.9 - Startup funnel from the Node executable down to user code execution.
Keep in mind that none of this work comes for free. For a tiny script, you won't even notice the overhead, but when you're dealing with massive services, serverless functions, or containers on slow storage, startup latency becomes a real constraint. Don't guess about these numbers - profile your startup, measure your module loading times, and be deliberate about what belongs in your cold start versus what can wait until the process is fully ready.
The diagram above compresses a lot of stuff - like native setup, internal JavaScript bootstrapping, and module evaluation - into a single clean path. Just remember that the real-world startup sequence has even more branches to handle custom flags, snapshots, preload hooks, loaders, permissions, and platform-specific tweaks.
V8 and Native Module Initialization
As soon as native initialization kicks off, V8 and Node's core bindings immediately start shaping your process's memory profile. This background setup is the reason why a newly started service can show a surprisingly high Resident Set Size (RSS) before it ever starts listening for incoming traffic.
Heap Allocation and the JIT
When Node spins up a V8 isolate, the engine sets up the JavaScript heap and establishes its boundaries. You probably think of the heap as one massive, contiguous block of physical memory grabbed entirely up front. No, that is not how it actually works. Instead, V8 reserves a broad virtual space and manages distinct heap categories, committing actual physical memory pages only when they are truly needed. You can inspect these exact internal metrics - including total_heap_size, used_heap_size, and heap_size_limit - at any time by calling v8.getHeapStatistics().
Let's look a bit closer at what are pages and how they actually work. Like we just talked, When Node starts up, the V8 engine doesn't grabs one massive block of physical RAM from your computer all at once. Instead, it stakes out a large virtual memory space and chops it up into small, fixed-size pieces called pages, which are usually between 512 KB and 1 MB.
These are just placeholders. V8 only fills them with actual physical RAM on demand, right when your code creates new data and explicitly needs the space. As your application runs and those active pages fill up, V8 requests new ones from the operating system. Flip that around, and if garbage collection empties a page out completely, V8 can safely hand that memory back to your computer.
You can actually watch this page management happen in real-time by calling v8.getHeapStatistics(). When you look at the output, total_heap_size shows you the total memory space V8 has claimed for these pages, while used_heap_size tells you exactly how much actual data is currently sitting inside them.
While you can easily configure the upper boundary using flags like --max-old-space-size, you should remember that your startup RSS accounts for much more than just the JavaScript heap. It also wraps in native C++ allocations, executable code pages, thread stacks, internal buffers, and shared libraries.
Another common misconception is that V8's Just-In-Time (JIT) compiler completely "warms up" during this initial launch phase. It does not. We talked about this in a previous chapter - V8 engine intro, to recap - the optimization pipeline is entirely demand-driven. A function only becomes a candidate for heavy optimization after real runtime feedback proves that it is actively hot. During early startup, the engine simply parses and baseline-compiles the code to get it running inside the interpreter, saving the heavy optimization choices for when your real application workload hits.
While V8 claims a large virtual memory range to enforce its internal limits, the operating system usually won't allocate physical memory pages right away. This behavior depends mostly on your specific OS and flags like --max-old-space-size or --initial-old-space-size.
Wiring the Native Modules
Built-in modules like node:fs, node:http, and node:crypto act as bridges between your JavaScript code and Node's low-level C++ internals. While part of the code you interact with is written in standard JS, all the heavy lifting underneath is handled by native bindings that talk straight to the operating system.
When Node starts up, it doesn't eagerly load every single built-in module right away. Doing that would make boot times painfully slow. Instead, it just registers the core definitions and native bindings as a placeholder map, waiting to actually initialize them until your JavaScript code explicitly asks for them.
The very first time your code calls require("node:fs"), the execution follows a simple, straightforward path -
- The module loader flags
node:fsas a built-in module rather than a local file path. - It routes the request straight through Node's internal built-in module machinery.
- Node runs the initialization code for that module's JavaScript surface if it hasn't done so already.
- The fully built exports object gets saved into an internal cache and handed back to your code.
Keep in mind that built-ins are not stored in the standard, public require.cache object that you use for regular CommonJS files. While devs sometimes mess with require.cache to mock or hijack bare module names, using the modern node: prefix completely bypasses that kind of tampering. It guarantees you always get the authentic, untouched built-in module.
This lazy initialization strategy is great for saving upfront boot time. If your application never uses node:crypto, you never pay the performance tax for it. The catch is that this first-time loading is not free. If a deep dependency happens to call require("node:crypto") for the first time right in the middle of a hot request path, that one-time initialization cost gets shifted away from startup and right into your user's response latency.
Because of this, sometimes you are actually better off preloading heavy dependencies during the initial bootstrap phase. It makes your app take a little longer to start up, but it makes your runtime latency much more predictable when traffic starts hitting. For code paths that rarely get touched, sticking with lazy loading is usually the right call - just make sure you profile and measure your specific service before making a definitive choice.
Module Loading During Startup
We all think that require() is a simple function call. But don't let the clean syntax fool you. For file modules, that single line kicks off a heavy chain of synchronous operations. It has to resolve the path, read from the disk, wrap the code, compile it, execute it, and cache the result. If your application has a massive dependency graph, this hidden work will completely mess up your cold start times.
This is exactly why a production service can look perfectly healthy on your local machine but completely fail when you deploy it. In one real-world case, an app took just 3 seconds to start on developer laptops and roughly 5 seconds in staging, but spiked to nearly a minute in production. The application heavily maxed out the CPU long before it could even open a port to listen for traffic. Because this slow startup blew right past the orchestrator's readiness deadline, the container was killed before it ever became ready, trapping the deployment in a never-ending crash loop.
If you are trying to hunt down these bottlenecks, you might try using the --trace-sync-io diagnostic flag. This flag prints out full stack traces whenever it catches synchronous I/O. But there is something to keep in mind - it only detects synchronous I/O that happens after the event loop has completed its very first turn. That makes it great for catching bad habits that trigger during normal runtime - like someone putting a lazy require() inside an active request handler - but it is not a reliable tool for catching the initial, top-level require() work that happens before the event loop even starts moving.
To fix a sluggish initial startup, you are much better off using CPU profiles, dependency audits, and targeted instrumentation around your module loading. So, for file modules, require() forces path resolution, file reads, wrapping, compilation, execution, and caching to happen entirely synchronously.
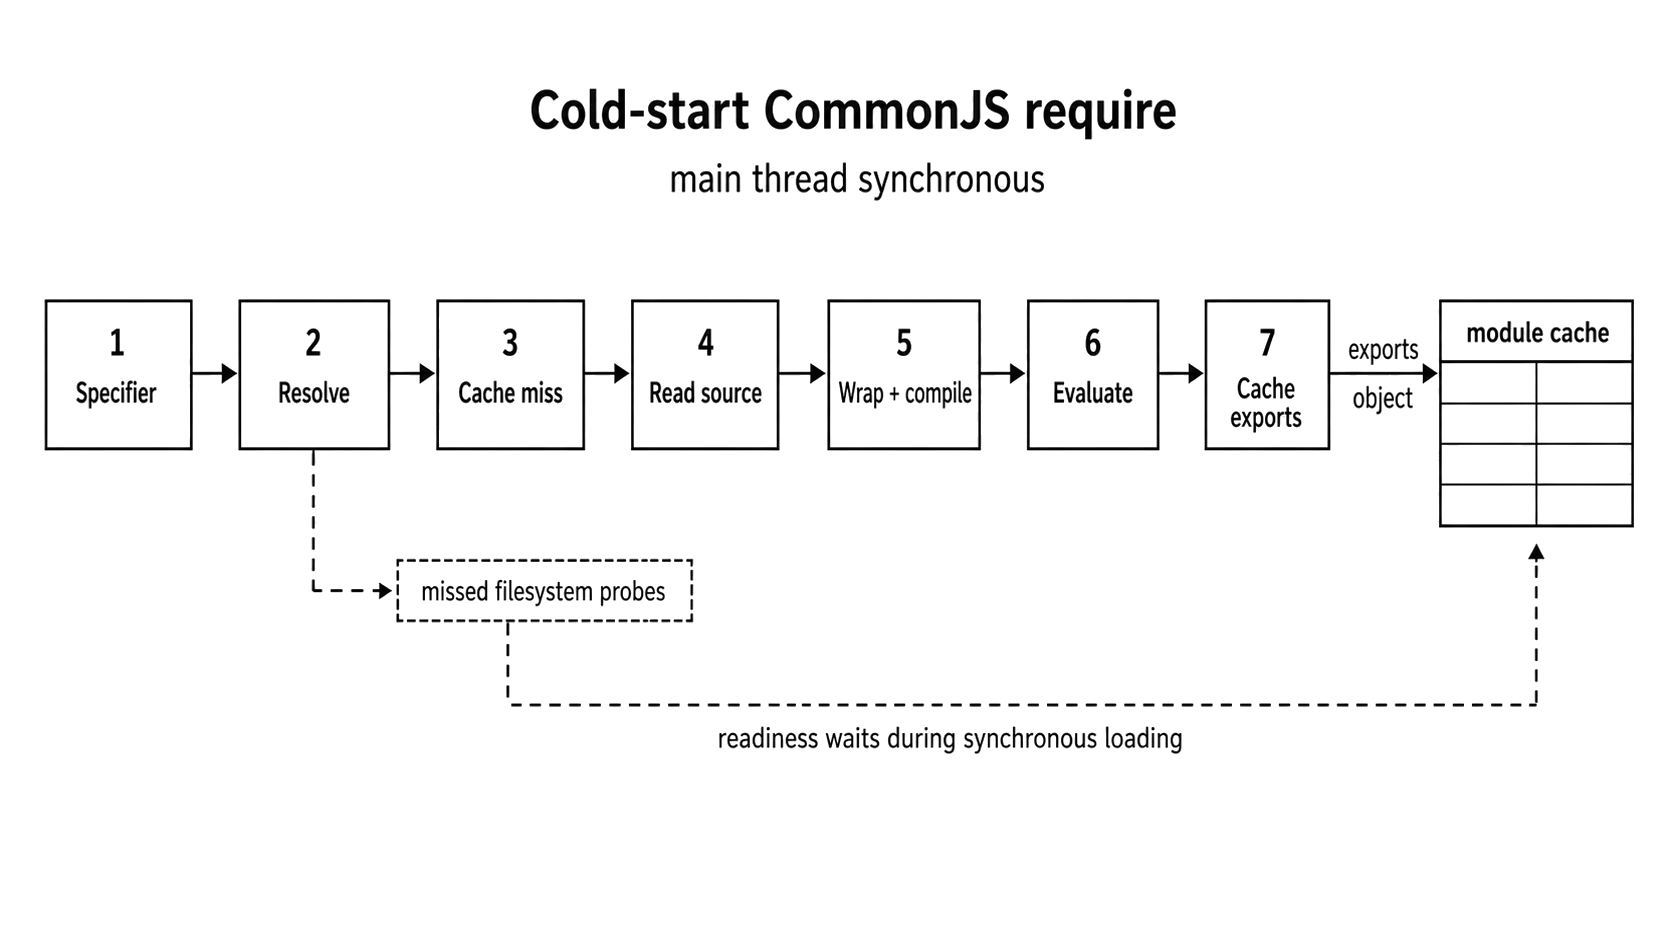
Figure 1.2 - A first-time require() performs synchronous resolution, source preparation, evaluation, and cache retention before readiness can move forward.
When you hand Node a string like './utils' or 'express', it can't just load it blindly. First, it has to track down the absolute path to that specific file on your machine. This lookup process branches out into three separate paths depending on how you wrote the import string:
- Core modules like
"node:fs","node:path"are the simplest. Node recognizes these instantly and resolves them internally without wasting any time searching through your local folders. - Relative paths starting with
./or../point directly to a local file. When you drop the file extension in CommonJS, Node guesses the format by looking for.js,.json, and.nodein that exact order. It never automatically checks for.mjsduring this extensionless guessing. While Node v24 allow you to explicitly userequire("./module.mjs")to load a synchronous ES module that avoids top-levelawait, that follows a completely different path from standard CommonJS extension guessing. - Bare package names like
'express'trigger a recursive crawl up your directory tree. Node checks your current folder's./node_modules, then hops up to../node_modules, and keeps climbing all the way to the root of your file system. Every single folder it misses along the way adds slow, synchronous disk work to your application's startup time.
The moment Node successfully highlights the file's exact location, it doesn't immediately read from disk, it performs a quick check against the internal CommonJS module cache as follows.
- If the module is already sitting there - a cache hit - Node bypasses the disk entirely and instantly returns the existing
exportsobject. Callingrequire("express")a second time is significantly cheaper because of this, though Node still has to do a quick internal lookup to grab it. - If the module isn't there yet - a cache miss - Node has to do the heavy lifting. It creates a brand-new internal
Moduleobject, reads the raw file data straight from your disk, and prepares the code for compilation.
Whenever Node encounters a cache miss, it takes the raw source code from your file and wraps it inside an internal function that looks like this.
(function (exports, require, module, __filename, __dirname) {
  // Your module's code goes here
    });
You've probably seen this pattern in library code, isn't it? This wrapper is the exact reason CommonJS modules get their own local variables. V8 compiles and executes this wrapped code, and whatever your module assigns to module.exports is the exact value handed back whenever someone else calls require().
To put this into perspective, a production service can be hit with a massive 5-15+ second startup delay caused entirely by a bloated node_modules directory. Every single require() call triggered a chain of synchronous filesystem checks. While you might not notice this performance tax on a fast local SSD, it becomes a massive bottleneck on production network-attached storage (NFS). Those tiny lookup delays can quickly multiply until the application is terminated by the orchestrator.
You can resolve this with a straightforward, two-part fix. First, used a bundler on that measured production startup path to eliminate those runtime filesystem lookups. Second, run a thorough dependency audit to strip away unnecessary nested tree depth.
Don't just casually bundle an entire Node server. Doing this blindly can easily break dynamic import() calls, conditional exports, native binary modules, and direct runtime file access. If you are trying to fix a startup bottleneck, bundle only the specific paths you have measured and make sure to rigorously test the final production build.
This kind of dynamic behavior can trigger a completely different headache, i.e the module cache memory leak. If you have a long-running process, its memory footprint will just keep growing until the operating system steps in and kills it with an Out-Of-Memory (OOM) error. This happens because every module you generate stays reachable and alive inside require.cache. Take a look at this snippet, which may turn up in a real-world heap snapshot for a slow report-rendering service -
function renderReport(templateName) {
  // templateName is a unique path like '/tmp/report-1662781800.js'
  const template = require(templateName); // Anti-pattern.
  return template.render();
}
Because every single templateName is a unique file path, Node will treated each call as a brand new module. It will load the file, compile the JavaScript, and store it in require.cache. After running for just a single day, the cache will fill up with tens of thousands of permanent entries. To make matters worse, this pattern is a massive security risk if an end user can control or influence that templateName string.
You are much better off using an established template engine that supports precompilation and built-in cache limits, or simply compiling your trusted templates once and reusing those functions. Also, don't look to the node:vm module as a safety net - it is not a security boundary and should never be used to run untrusted code.
The module system carries a lifecycle cost ie. each file module loaded through require() adds synchronous startup work and locks down a piece of memory. You're better off treating runtime module loading as an explicit, careful design decision rather than a quick workaround.
Sure, you can technically clean things up manually by running delete require.cache[path]. But honestly, using require() to pull in runtime, user-driven files is unsafe and almost always the wrong abstraction for handling templates or short-lived code.
ES Modules During Startup
The difference between CommonJS (require) and ES modules (import/export) is way deeper than just having a different syntax. They operate on completely different loading lifecycles.
Node's shift from CommonJS to ESM was a long, not an easy road though. Today, Node supports both systems, but they still use entirely different resolution rules, and evaluation behaviors.
An import statement is not a drop-in alternative to require(). With static ESM imports, the loader builds an entire dependency graph before a single line of code actually runs. CommonJS, on the other hand, jams resolution, loading, and execution all together inside one single, blocking function call.
The Three-Phase Lifecycle of ESM
The ESM loading process happens in three different steps. You need to keep in mind that your actual module code does not execute until the very last phase.
Phase 1 is Construction, which handles the parsing. When Node sees a static import, it does not run that imported file right away. Instead, it parses the syntax, recursively follows every single import it finds, and maps out the entire dependency graph before evaluating anything. This is a big advantage because the loader can catch resolution errors and syntax issues before your application even starts running.
Dynamic import() statements and custom loaders can modify this graph at runtime. Static imports give the loader a clean blueprint upfront, but dynamic imports will still wait to trigger until your code actually hits them.
Phase 2 is Instantiation. Once Node has a complete graph, it sets up the module environments and wires your imports directly to their corresponding exports as live bindings. Note that an imported value is not a copy instead its a direct pointer to the exporting module's variable. These connections exist before any code executes, even though the actual values won't be initialized until the code runs.
The final phase is Evaluation. This is where Node finally executes the module bodies in dependency order, while cleanly handling any dependency cycles or top-level await statements. Since the structural bindings were already wired up during instantiation, this step simply fills those empty slots with the actual values your code generates.
To sum it up - require() forces Node to find, load, and run code all in one frantic, blocking step. ESM takes a step back and separates the work into graph construction, instantiation, and evaluation.
CommonJS Assumptions That Break
The biggest risk when moving to ES Modules is assuming the code will still execute with CommonJS timing and rules.
First, standard CommonJS local variables like __filename and __dirname simply do not exist in ES modules. If you try to use them, your code will crash:
// throws a ReferenceError in an ES module
console.log(__filename);
console.log(__dirname);
Starting fully in Node v24, you can grab this path metadata directly from import.meta. (These properties technically arrived back in Node v20.11 and v21.2, but they were out of their experimental status in v24.0) -
import { join } from "node:path";

console.log(import.meta.filename);
console.log(import.meta.dirname);
console.log(join(import.meta.dirname, "logs.txt"));
If you are stuck supporting older Node versions, you have to manually derive those values from the file's URL -
import { fileURLToPath } from "node:url";
import { dirname, join } from "node:path";

const __filename = fileURLToPath(import.meta.url);
const __dirname = dirname(__filename);

console.log(join(__dirname, "logs.txt"));
The biggest lifecycle shift, however, is the native support for top-level await.
Because the ESM loader is designed to pause evaluation, you no longer have to wrap your startup logic in a fake async function. You can use await right at the top level of the file.
Here is how you had to write it in CommonJS:
// CommonJS: wrap startup in an async function.
async function main() {
  const db = await connectToDatabase();
  startServer(db);
}

main().catch((error) => {
  console.error("Startup failed:", error);
  process.exitCode = 1;
});
And here is how clean it looks in ES modules:
// ES modules: top-level await is allowed.
import { connectToDatabase } from "./database.js";
import { startServer } from "./server.js";

console.log("Connecting to database...");
const db = await connectToDatabase();
console.log("Database connected!");

startServer(db);
Just remember that this only works if Node actually treats the file as an ES module-meaning you either gave it an .mjs extension or set "type": "module" in your package.json.
When you use top-level await, the entire Node process stops and waits during module evaluation until that promise settles. If the promise hangs and never resolves, Node will eventually give up and exit with code 13.
Startup Impact
The way ESM separates its lifecycle actually gives the loader a huge advantage. Because Node can map out the entire dependency graph statically before it runs any code, the loader has a much clearer picture of your application's structure compared to runtime CommonJS calls. While Node's default ESM loader doesn't pull modules randomly from the network, custom loaders or other runtimes can easily support those kinds of sources.
Static imports are also a big win for build tools. When you write import { thing } from "...", it is completely declarative. This means tools can read and understand your code without ever having to execute it. This is exactly what allows bundlers like Rollup or Webpack to perform tree shaking-safely stripping out unused exports from your final bundle far more reliably than they ever could with dynamic CommonJS loading.
Caching behaves differently too. The ESM loader uses its own module map, but unlike the old require.cache, it is completely private and immutable. You can't just delete an entry to force a hot reload the way you might have done in CommonJS.
Today's ecosystem is a mix of both worlds. You are going to encounter CJS-only packages, ESM-only packages, and conditional exports. Just remember that these two loaders have different timing and caching rules-do not assume you can swap one for the other without completely changing how your application starts up.
Process Bootstrapping Pattern
The moment Node hands control over to your entry module, your application's real bootstrap begins. This is when you load configs, connect to databases, spin up your server, and actually decide when your process is ready to handle real traffic.
Let's look at a very typical, but ultimately flawed, server bootstrap. We all have done this at some point -
const config = require("./config"); // Sync I/O
const database = require("./database"); // More sync I/O

database
  .connect(config.db)
  .then(() => {
    const app = require("./app"); // Loads Express, routes, etc.
    app.listen(config.port);
  })
  .catch((err) => {
    console.error("Bootstrap failed.", err);
    process.exit(1);
  });
At first glance, this looks fine. But read it through the lens of a process lifecycle and the cracks show up immediately.
First, all of those top-level require() calls are completely synchronous. If your config or database modules do anything even slightly intensive, they block the entire startup process. As we saw earlier, this can easily cause a considerable amount of delay.
Second, that database.connect() call is asynchronous, which is exactly what you want. But if the database is down, this code logs an error and instantly kills the process with process.exit(1). If you are running this in Kubernetes, that triggers an immediate pod restart. The new process boots up, hits the exact same dead database, fails again, and suddenly you are stuck in a CrashLoopBackOff - blindly hammering an already broken service with constant restart traffic.
Now finally, the exact order you require() stuff can become an issue. If ./app blindly assumes the database is already connected, you have just created an implicit, hidden dependency that will break the second someone moves those lines of code around.
The Async Initializer
You are much better off wrapping your startup sequence in an explicit async initializer. This allows you to track exactly what has started and lets the process exit naturally after cleaning itself up if things go sideways.
const { once } = require("node:events");

const state = { db: null, server: null, serverListening: false };

async function start({ config, database, createApp }) {
  state.db = await connectWithBackoff(() => database.connect(config.db));
  state.server = createApp({ db: state.db }).listen(config.port);
  await once(state.server, "listening");
  state.serverListening = true;
}
Notice that connectWithBackoff wrapper? The retry policy belongs in one central place. Instead of having every failing process try to reconnect at the exact same instant, you add backoff and jitter to space those attempts out safely.
async function connectWithBackoff(connect, maxAttempts = 5) {
  for (let attempt = 1; attempt <= maxAttempts; attempt += 1) {
    try {
      return await connect();
    } catch (error) {
      if (attempt === maxAttempts) throw error;
      const delay = Math.min(250 * 2 ** attempt, 5_000);
      await new Promise((resolve) => {
        setTimeout(resolve, delay + Math.floor(Math.random() * 100));
      });
    }
  }
}
By recording each resource as it becomes active in our state object, the failure path has enough information to close only the resources that actually opened successfully. If the server never started, let's not try to stop it.
async function stop() {
  if (state.server && state.serverListening) {
    await new Promise((resolve, reject) => {
      state.server.close((error) => (error ? reject(error) : resolve()));
    });
    state.serverListening = false;
  }

  if (state.db) {
    await state.db.close();
    state.db = null;
  }
}
Now, the actual entry point can report a startup failure, set the exit code, run the cleanup phase, and simply let the event loop drain out naturally.
start({
  config: require("./config"),
  database: require("./database"),
  createApp: require("./app"),
}).catch(async (error) => {
  console.error("FATAL: Application failed to start.", error);
  process.exitCode = 1;
  await stop();
});Instead of retrying in a tight loop, always add backoff and jitter so multiple processes don't accidentally DDoS your database. Use a proven retry library when possible, and ensure your startup operations are safe to run more than once. If a dependency stays down permanently, rely on health checks or circuit breakers so your startup sequence doesn't amplify the outage.
This pattern does a lot of heavy lifting for you. It makes the startup order explicit, gives transient database failures a safe retry path, keeps dependencies easily injectable for tests, and treats the server's listening event as the true readiness point.
And remember, readiness is not the same as liveness. A process can be "alive" just because it has open handles keeping the event loop running. It can even be actively listening on a socket. But it still might not be truly ready if its configuration, database migrations, or warm caches haven't finished loading. You should only publish readiness to your load balancer after the application is actually capable of handling its first real request correctly.
You shouldn't think of bootstrapping as only getting the server running, instead reaching a predictable, observable state, and failing gracefully with the right exit code when that state simply cannot be reached.
How should a Node.js process handle SIGTERM?
You should handle SIGTERM as your standard shutdown request, especially on production. When this signal arrives, you want to mark the application as draining, stop accepting new incoming work, finish whatever is currently in-flight, close your database connections, set the process.exitCode, and let the event loop empty out naturally.
Once your app is running, something will eventually tell it to stop - whether that is a developer, a deployment script, or a container orchestrator. On Unix-like systems, this happens through signals. Think of a signal as a software interrupt sent straight from the operating system to your process.
For lifecycle management, you really only need to care about a handful of these signals -
SIGINTis the standard interrupt you trigger when hittingCtrl+Cin your terminal.SIGTERMis a polite request to terminate gracefully. Orchestrators like Kubernetes use this as their default shutdown signal, so always treat it as your primary trigger.SIGHUPliterally means "hang up". Background daemons often use this to reload their configurations without forcing a full restart.SIGKILLis the operating system pulling the plug immediately. Kubernetes drops this hammer when a process ignores aSIGTERMbeyond its allowed grace period.SIGUSR1andSIGUSR2are custom user-defined signals. Node explicitly reservesSIGUSR1to start the debugger, so if you want to trigger internal diagnostics like a heap snapshot, always stick toSIGUSR2.
If you are building for multiple platforms, handle SIGINT and SIGTERM where they exist, but do not rely exclusively on them. Windows does not actually have a POSIX signal model - Node just emulates a few signal names to make cross-platform development easier. For services that demand strict portability, you should also expose a programmatic shutdown trigger, like an IPC message from a parent process.
In Node, you listen for these signals directly on the global process object, which acts as a standard EventEmitter.
console.log(`My PID is: ${process.pid}`);

let shutdownStarted = false;

const shutdownManager = {
  async stop(signal) {
    // Close the HTTP server, database pools, workers, and other resources here.
    console.log(`Shutdown manager handling ${signal}.`);
  },
};

async function startShutdown(signal) {
  if (shutdownStarted) return;
  shutdownStarted = true;

  console.log(`Received ${signal}. Starting shutdown.`);
  process.exitCode = 0;

  try {
    await shutdownManager.stop(signal);
  } catch (error) {
    console.error("Shutdown failed:", error);
    process.exitCode = 1;
  }
}

process.once("SIGTERM", () => startShutdown("SIGTERM"));
process.once("SIGINT", () => startShutdown("SIGINT"));

// Keep the process alive so you can send it signals.
setInterval(() => {}, 1000);
This small script just helps you observe how signal delivery works. We deliberately left an interval running so the process stays alive. To test it out, run the script, grab the printed PID, and open a second terminal to run kill -s SIGTERM <PID>.
The moment you add a custom listener for SIGINT or SIGTERM, Node instantly disables its default behavior of killing the process. If your custom shutdown logic leaves any active handles open, your application will just sit there running indefinitely until the operating system finally loses patience and sends a SIGKILL.
Signal Handling Issues
Catching process signals may now seem straightforward, until your dependencies get involved. You might set up a SIGTERM handler, only to watch your orchestrator kill the process with a SIGKILL a few seconds later anyway.
A common reason for this is a dependency that registers its own signal handlers. The worst-case scenario is a library calling process.removeAllListeners("SIGTERM") before attaching its own logic.
Your process.on("SIGTERM", ...) handler is not protected from the rest of your codebase. A "good production" service needs exactly one centralized shutdown manager that other modules hook into. You should never let arbitrary libraries dictate your process-level exit policy.
By default, process.on just adds handlers to a queue, and they run in the exact order they were registered. There's a danger though, from undocumented libraries that actively remove other listeners or try to own the shutdown flow themselves. It rarely happens, but you need to be aware of it.
This is exactly why your signal handlers need to be tiny. All they should do is flip the application into a shutdown state and hand off the actual cleanup work to your normal application logic.
These handlers are also your last line of observability. Avoid writing any code that could throw an error inside your uncaughtException, unhandledRejection, or SIGTERM listeners. If your last-chance handler crashes, Node will often replace the original failure with the handler's error, completely burying the actual root cause you need to debug.
The safest pattern relies on idempotency - meaning it is completely safe if it accidentally gets called twice - and uses process.exitCode for the normal path:
let isShuttingDown = false;

async function gracefulShutdown(signal) {
  if (isShuttingDown) {
    return;
  }

  isShuttingDown = true;
  process.exitCode = 0;
  console.log(`Received ${signal}. Draining requests...`);

  const forceExit = setTimeout(() => {
    console.error("Graceful shutdown timed out. Forcing exit.");
    process.exit(1);
  }, 10_000);
  forceExit.unref();

  try {
    await new Promise((resolve, reject) => {
      server.close((error) => {
        if (error) reject(error);
        else resolve();
      });
    });

    await database.close();
    console.log("Graceful shutdown complete.");
  } catch (error) {
    console.error("Graceful shutdown failed:", error);
    process.exitCode = 1;
  } finally {
    clearTimeout(forceExit);
  }
}

process.once("SIGTERM", () => gracefulShutdown("SIGTERM"));
process.once("SIGINT", () => gracefulShutdown("SIGINT"));
Notice how the actual signal listener does almost nothing - it just kicks off gracefulShutdown. That dedicated function takes over managing the state, cleanup order, exit status, and a hard timeout guard. We reserve process.exit() for that timeout path, catching the exact scenario where the normal graceful drain has officially failed.
Keep your shutdown policy locked down in one place. Force your modules to register their cleanup callbacks with your custom shutdown manager, rather than letting them attach process-level signal listeners directly. If you have a dependency with a history of modifying signals, actively track your listener counts in production.
Graceful Shutdown
You might think shutting down an application just means killing the process. No, that is not how you build a reliable service. A proper graceful shutdown is a controlled, step-by-step exit. It should function as the exact inverse of your bootstrap sequence.
The main point here is a very specific state transition ie. Accepting Traffic -> Draining -> Closed.
- First, you stop accepting new work. For a web server, calling
server.close()handles this. It immediately rejects new connections while allowing existing ones to finish. - Next, you finish in-flight work. This is called draining. Your app has to wait for whatever is already running - like active HTTP requests, database transactions, queue messages, background jobs, or active file writes.
- Then, you clean up your resources. This means closing database pools, disconnecting from Redis or RabbitMQ, stopping background workers, and flushing your telemetry data. Order is absolutely critical here. You do not want to close a database connection while an active HTTP request is still trying to read from it.
- Finally, you set
process.exitCode = 0to signal a successful shutdown and simply let the event loop empty out naturally. You should strictly reserveprocess.exit()for hard timeouts or fatal errors during early startup.
Here is what that flow looks like -

Graceful shutdown is literally the reverse of your startup. You close the entry points first, then tear down the dependencies, and let Node exit only when no referenced work remains.
If you close the database before your HTTP handlers finish draining, you turn a graceful shutdown into a wave of failed requests.
To do this perfectly right, your application actually needs to track its in-flight work before the shutdown even begins. For an HTTP server, that can be as simple as counting responses that have not finished or closed yet -
let activeRequests = 0;

server.on("request", (_req, res) => {
  activeRequests += 1;
  let counted = true;

  const done = () => {
    if (!counted) return;
    counted = false;
    activeRequests -= 1;
  };

  res.once("finish", done);
  res.once("close", done);
});
Once you track that state, your dedicated shutdown function takes full ownership of the state transition, the exit status, the cleanup order, and the hard deadline.
let isShuttingDown = false;

async function gracefulShutdown(signal) {
  if (isShuttingDown) return;
  isShuttingDown = true;
  process.exitCode = 0;
  console.log(`Received ${signal}. Starting graceful shutdown.`);

  const timeout = setTimeout(() => {
    console.error("Shutdown timed out. Forcing exit.");
    process.exit(1);
  }, 15_000);
  timeout.unref();

  try {
    await closeServer(server);
    if (activeRequests > 0) {
      console.warn(`Closed server with ${activeRequests} active requests.`);
    }
    await db.close();
  } catch (error) {
    console.error("Error during graceful shutdown:", error);
    process.exitCode = 1;
  } finally {
    clearTimeout(timeout);
  }
}
Because the server close operation relies on callbacks, you are better off wrapping it in a Promise to keep your main shutdown flow readable -
function closeServer(server) {
  return new Promise((resolve, reject) => {
    server.close((error) => (error ? reject(error) : resolve()));
  });
}
With that function in place, your actual signal handlers do nothing but start the sequence -
process.once("SIGTERM", () => gracefulShutdown("SIGTERM"));
process.once("SIGINT", () => gracefulShutdown("SIGINT"));
Many developers use process.exit() to forcefully shut down a running service. Do not do this. It terminates the process synchronously and immediately abandons any pending asynchronous work, including buffered I/O. Always prefer setting process.exitCode alongside explicit handle cleanup. Only reach for process.exit() when the graceful path has completely failed, or when a simple CLI tool has nothing left to drain.
What keeps a Node.js process running?
Think about it for a moment. We've just talked about it.
It's not like that the process shuts down the moment the main script finishes executing. For basic script, yes you can go with that model, but it's not how it works. A Node process exits naturally only when there is absolutely nothing left keeping it awake. If you finish your main application code but leave a timer, an active network socket, or a background worker running, the process stays alive.
We saw in the previous section that, a hanging process usually means a referenced handle is still active somewhere in the background.
A failure scenario might looks like this - an API server suddenly starts crashing with Error: EMFILE: too many open files right after a few deployments. If you check the system logs, you will find thousands of open file descriptors, mostly network sockets stuck waiting to close. The shutdown path might have successfully closed the main server, but another subsystem leaked active sockets. The process hangs, eventually gets killed by the orchestrator, and forces the operating system to clean up the mess. Rapid restarts during deployment can easily pile up enough of these open sockets to exhaust your system's entire file limit.
To fix this, you need to know what a handle actually is. In Node.js, a handle is a native libuv object representing a long-lived resource. This could be an active server, a network socket, a timer, a background worker, or a child process.
By default, every single one of these handles is referenced. A referenced handle is just a flag telling the event loop that the application still has work to finish. The process will only exit on its own when every last referenced handle and active request is completely gone.
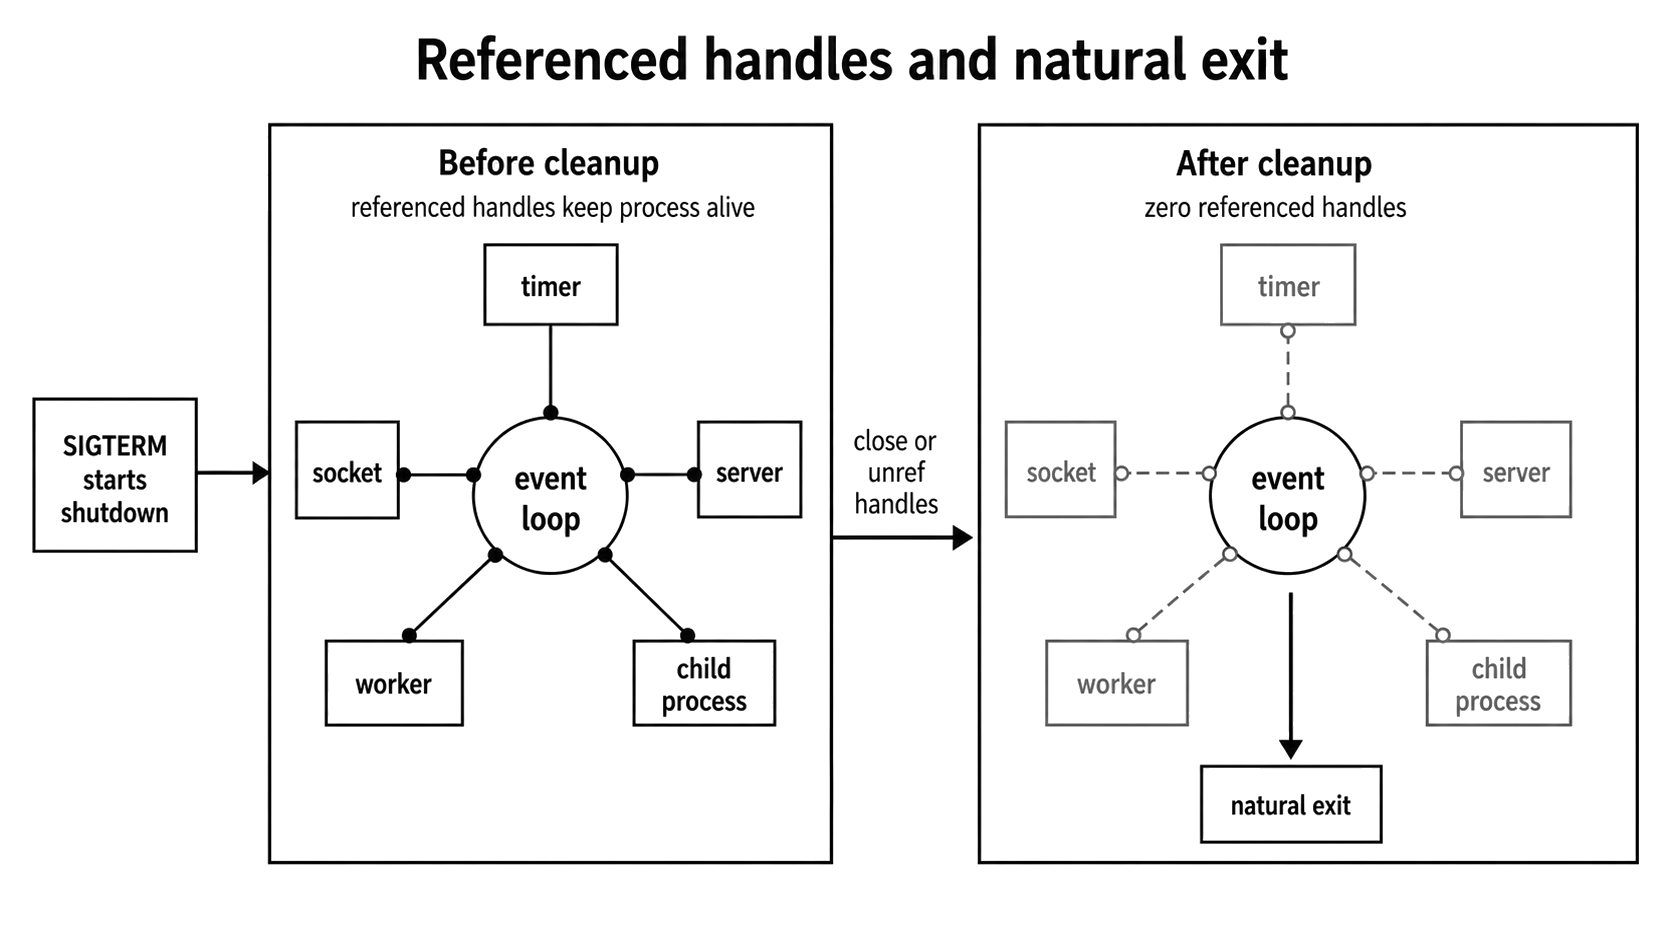
Figure 1.3 - Shutdown can begin from a signal, but the process exits naturally only after referenced handles such as timers, sockets, workers, and child processes have closed or been unreferenced.
For example, the following process will stay alive forever -
// This process will never exit.
// The setInterval creates a referenced handle that keeps it alive forever.
setInterval(() => {
  console.log("Still here...");
}, 1000);
But, now we already know, that we can call .unref() on a timer or other supported handles. This specifically tells the event loop not to keep the process alive just for this one task.
// This process WILL exit immediately.
const timer = setInterval(() => {
  // This will never even run.
  console.log("You won't see me.");
}, 1000);

timer.unref();
Going back to that hypothetical EMFILE incident, those leaked socket handles remained referenced, which kept the entire process artificially alive until the orchestrator finally stepped in and killed it.
Here is a small server example demonstrating exactly how active connections directly impact your shutdown sequence. The snippets below all belong together in a single server.js file.
A Leaked-Handle Example
The server delays its response long enough for you to send it a signal while a client connection is still open.
const http = require("node:http");

const activeSockets = new Set();
let isShuttingDown = false;

const server = http.createServer((_req, res) => {
  console.log("Client connected.");
  const work = setTimeout(() => {
    if (res.writableEnded || res.destroyed) return;
    res.writeHead(200, { "Content-Type": "text/plain" });
    res.end("Hello from the slow server!\n");
  }, 20_000);

  res.on("close", () => clearTimeout(work));
});
The connection event gives the shutdown path access to the underlying sockets. Without that tracking, the server can stop accepting new connections but still wait on existing ones.
server.on("connection", (socket) => {
  activeSockets.add(socket);
  socket.on("close", () => activeSockets.delete(socket));
});

server.listen(0, () => {
  const { port } = server.address();
  console.log(`Server started on port ${port} with PID: ${process.pid}`);
  console.log(`   Run "curl http://localhost:${port}" in another terminal.`);
  console.log(`   Then, run "kill ${process.pid}" to send the shutdown signal.`);
});
When shutdown starts, server.close() stops new connections and waits for existing ones. After 5 seconds, the script destroys any sockets still open -
function shutdown(signal) {
  if (isShuttingDown) return;
  isShuttingDown = true;
  process.exitCode = 0;

  console.log(`\n${signal} received: closing HTTP server...`);

  let forceClose;

  server.close((err) => {
    clearTimeout(forceClose);

    if (err) {
      console.error(err);
      process.exitCode = 1;
      return;
    }

    console.log("All connections closed. Server shut down successfully.");
  });

  forceClose = setTimeout(() => {
    console.error("Could not close connections in time. Destroying sockets.");

    for (const socket of activeSockets) {
      socket.destroy();
    }
  }, 5_000);
  forceClose.unref();
}

process.once("SIGTERM", () => shutdown("SIGTERM"));
process.once("SIGINT", () => shutdown("SIGINT"));
Run the script and take note of the Process ID (PID) it prints.
node server.js

Server started on port 37643 with PID: 54321
   Run "curl http://localhost:37643" in another terminal.
   Then, run "kill 54321" to send the shutdown signal.
In a second terminal, use curl to connect to the server. Because of the 20-second delay in the handler, this command will hang, keeping the socket connection open.
curl http://localhost:37643While curl is still waiting, use another terminal to run kill with the PID from the previous output.
# Replace 54321 with the actual PID of your server process
kill 54321
In the terminal where the server is running, you will see the following happen in order.
The server immediately prints -
SIGTERM received: closing HTTP server...At this point, server.close() has been called, but the process does not exit because the curl connection is still active. After 5 seconds, the timeout in the shutdown logic fires because the open connection is preventing a graceful exit -
Could not close connections in time. Destroying sockets.The script now destroys the lingering socket, finally allowing the process to terminate. Your curl command in the other terminal will likely fail with an error like curl: (56) Recv failure: Connection reset by peer.
server.closeIdleConnections() and server.closeAllConnections() were added in Node v18.2. Starting with Node v19.0, server.close() already closes idle keep-alive connections before returning, so closeIdleConnections() is mainly useful for compatibility with older supported runtimes. Call either helper after server.close() to avoid races. closeAllConnections() is a hard fallback, not the graceful path, because it can close active requests.
Debugging Handle Leaks
If you are running Node v24 or newer, the best place to start debugging handle leaks is the process.getActiveResourcesInfo() method. It returns a straightforward list of resource type names representing exactly what is currently keeping your event loop alive. This API does exist in older release lines, but keep in mind it was experimental before Node v22.16 and v24.0.
You might see devs mention process._getActiveHandles(). This is an internal API. While it can be helpful for digging around during local debugging because it exposes the actual handle objects, it is not a guaranteed contract and might omit or obscure important details. Always prefer the stable process.getActiveResourcesInfo() when you need reliable resource visibility.
Here is a quick way to use it -
const net = require("node:net");

function printActiveResources(label) {
  console.log(`\n${label}`);
  console.log(process.getActiveResourcesInfo());
}

function printInternalHandlesForDebugging() {
  const names = process._getActiveHandles().map((handle) => {
    return handle.constructor.name;
  });

  console.log(names);
}
With those helper functions ready, let's create a server and a timer, inspect the active resources, and then clean them up to see the difference.
printActiveResources("Initial state:");

const server = net.createServer(() => {});

server.listen(0, () => {
  printActiveResources("After creating server:");

  const timer = setInterval(() => {}, 5_000);
  printActiveResources("After creating timer:");

  console.log("\nInternal handles for local debugging only:");
  printInternalHandlesForDebugging();

  clearInterval(timer);
  server.close(() => {
    // A small delay to make sure cleanup actually finishes before checking again
    setTimeout(() => {
      printActiveResources("After cleanup:");
    }, 100);
  });
});
When you run this, you will see internal resource names pop up like TCPServerWrap and Timeout. Notice that the internal handle list from _getActiveHandles() might not perfectly mirror the official resource list, especially when timers are involved.
If your process hangs during exit, drop a printActiveResources() call right before the point where you expect the shutdown to completely finish. Then, trace each resource type back to the subsystem that created it.
Also, note that the diagnostic setTimeout we used above to print the final state might briefly show up in your resource list. That is completely normal - just remember to account for your own debugging code before you start blaming your application logic!
Node does not automatically close the resources your application opens. The garbage collector only reclaims JavaScript memory. It does not handle your service's shutdown policy. If you open a server, a socket, a background worker, an interval timer, a file stream, a database connection pool, or a child process, your shutdown logic must explicitly call the matching close, abort, disconnect, clear, or kill operation.
Memory Lifecycle and Heap
A Node process's memory usage is not one simple number you can look at. To diagnose leaks and avoid Out-Of-Memory (OOM) crashes, you have to understand how Resident Set Size (RSS), the V8 heap, external memory, and native allocations all interact over time.
When your process first starts up, you will often see the RSS spike quickly for a few specific reasons -
- The V8 engine establishes its memory spaces and limits. It commits some memory immediately, while reserving other address space to use later.
- Every time you
require()a file, Node reads, wraps, compiles, executes, and permanently stores that code insiderequire.cache. - Things like
Bufferobjects (we'll talk about it in the next chapter - What is a Buffer), native C++ libraries, thread stacks, and OpenSSL states all add to your total RSS, but they do not show up inside standard JavaScript heap measurements likeheapUsed.
In a large service, module loading alone can be a massive fixed memory cost. But the exact size depends on the type of your application. You should always measure this yourself using process.memoryUsage(), heap snapshots, and startup profiles, rather than relying on generic rules of thumb.
If you chart this out, the memory graph almost always rises sharply right at startup:
Memory (RSS)
  ^
  |
  |      +-------------------------> Phase 2: Operational Plateau
  |     /
  |    /  <-- Module Cache Growth
  |   /
  |  /   <-- V8 Heap Init
  +-------------------------------------> Time
    ^
    Process Start
You can easily prove this by logging process.memoryUsage() right before and right after you load your heaviest dependencies.
Once your server is running and actively handling requests, memory usage usually settles into a predictable rhythm. Every incoming request creates new temporary objects, causing heapUsed to rise. Periodically, V8's garbage collector (GC) kicks in, sweeps away all those old, unreferenced objects, and heapUsed drops back down. In a healthy application, this creates a steady, repeating sawtooth pattern.
You know you have a memory leak when the bottom of that sawtooth keeps getting higher and higher over time. That means the GC is running, but it cannot delete certain objects because your code is still holding onto them.
One major source of confusion here is "external" memory. External memory is allocated completely outside of V8's normal JavaScript object heap. Some common examples are the raw memory blocks backing Buffer and ArrayBuffer objects. When you read a massive file into a Buffer, that data is not tracked the same way as an ordinary JavaScript object inside heapUsed.
Knowing this is actually very useful, your V8 heap might look perfectly healthy, but your total process RSS could be dangerously high because of massive buffers or native allocations. Heap snapshots are great, but remember they only show you one piece of the entire memory puzzle.
Exit Codes and Process States
When your Node process finally terminates, it sends an exit code back to whatever started it - whether that is a shell terminal, a supervisor script, systemd, Kubernetes, or a parent process. The rule is quite simple. 0 means the process finished successfully, and any non-zero number means it failed.
Node has a few built-in exit codes, but the most important one is 1, which is the default code for an uncaught exception. As a dev, you can control this exit code in two ways -
process.exit(code)immediately terminates the application. It skips any pending asynchronous work and forces the process to stop right then and there. You should only use this for fatal startup failures or short-lived CLI tools that have absolutely no cleanup left to do.process.exitCode = codedefers the status reporting. It tells Node exactly which code to use, but only after the event loop drains naturally and the process is actually ready to close.
Avoid calling process.exit() inside servers or long-running services, because it forces an immediate shutdown and skips important async cleanup tasks. You should consider setting process.exitCode and letting your graceful shutdown logic close everything out. Only use process.exit() for short-lived CLI tools or extreme early-startup failures where nothing else has even initialized yet.
By using these two APIs correctly, you keep your cleanup logic and your status reporting completely separate.
async function gracefulShutdown(error) {
  // ... do all your cleanup ...

  if (error) {
    console.error("Shutting down because of an error:", error);
    process.exitCode = 1;
  } else {
    console.log("Shutdown completed successfully.");
    process.exitCode = 0;
  }
  // Let the event loop empty out naturally. Node exits once all handles are fully closed.
}
Why Exit Codes Count in Production
A lot of devs think of exit codes as just text in a terminal. That is not even close. Container orchestrators like Kubernetes actually use your exit status to make important restart decisions. When your container exits, Kubernetes checks the code immediately. If it sees a non-zero number, it assumes a failure and restarts the container based on your restart policy. If it sees a 0, it assumes the process intentionally finished its job and might just leave it offline.
You can take advantage of this by creating your own application-specific exit codes to make startup failures much easier to diagnose. For example -
- Code 70 signals that the database connection failed during startup.
- Code 71 indicates an invalid or missing configuration file.
- Code 72 shows the server could not bind to the required network port.
With this setup, an alert triggering on exit code 70 tells your on-call engineer exactly where to look first, without forcing them to blindly dig through pages of raw logs.
If your application fails to connect to the database but still exits with code 0, it falsely tells the supervisor that everything went perfectly. Sending honest, meaningful exit codes is very important.
Child Processes and Cluster Lifecycle
Later chapters dive deeper into child processes, worker threads, and clustering. Right now, I'll focus on how adding more processes changes who is responsible for shutting them down.
Managing a single process is not the whole story. The moment you introduce the cluster module or spawn background workers using node:child_process, the parent process suddenly becomes responsible for orchestrating the shutdown of every single child it created.
The cluster Module
The cluster module is Node's built-in tool for running multiple worker processes that share the exact same server ports. In Node, the coordinating process is called the primary process. You might still see older code using cluster.isMaster, but that is deprecated - you should always use cluster.isPrimary.
When the primary process receives a SIGTERM signal, it needs to stop spawning new workers immediately. It then asks the existing workers to disconnect safely using cluster.disconnect(). At that point, the workers stop accepting new requests and run their own graceful shutdown logic. The primary process simply waits, only shutting itself down once everyone has disconnected or a hard timeout hits.
Here is what that coordination actually looks like in practice -
const cluster = require("node:cluster");

if (cluster.isPrimary) {
  // The primary process intercepts the termination signal.
  process.on("SIGTERM", () => {
    console.log("Primary received SIGTERM. Asking workers to disconnect...");

    // This tells all active workers to stop accepting new connections
    // and close down gracefully.
    cluster.disconnect(() => {
      // This callback fires ONLY after all workers have completely exited.
      console.log("All workers disconnected. Primary exiting safely.");
      process.exitCode = 0;
    });
  });
} else {
  // The code here runs inside the individual worker process.
  // When the primary calls cluster.disconnect(), it triggers this event.
  process.on("disconnect", () => {
    // This is where you drain database connections, close HTTP servers,
    // and let the event loop empty out naturally.
    console.log(`Worker ${process.pid} is shutting down...`);
  });
}
child_process and the Orphan Problem
When you spin up a background task using child_process.spawn() or fork(), you take on full responsibility for that child's lifecycle.
Many devs assume child processes die the moment their parent process dies. They do not. If a parent process is killed forcefully, its children become orphans. The operating system will just reassign them to the system's init process, and they will keep running in the background forever. You have to explicitly terminate them yourself, or rely on an external OS-level process manager to clean up the entire process group.
A responsible parent process must actively track its running children, send them a termination signal during shutdown, and explicitly wait for their close or error events before closing itself.
const { spawn } = require("node:child_process");

const children = new Map();
let isShuttingDown = false;

function trackChild(child) {
  // Use the Process ID (PID) as a unique tracking key.
  const key = child.pid ?? Symbol("child");

  // Create a promise that resolves only when the child actually finishes or fails.
  const done = new Promise((resolve) => {
    child.once("error", (error) => resolve({ error }));
    child.once("close", (code, signal) => resolve({ code, signal }));
  });

  // Store both the active child reference and its completion promise.
  children.set(key, { child, done });

  // Automatically clean up our tracking map once the child is gone.
  done.finally(() => children.delete(key));

  return child;
}
By structuring it this way, the parent can easily distinguish between "I asked the child to stop" and "the child is actually gone" by checking its final exit state.
function isChildRunning(child) {
  // If both codes are null, the process is still actively running.
  return child.exitCode === null && child.signalCode === null;
}

trackChild(spawn(process.execPath, ["worker.js"], { stdio: "inherit" }));
When it is time to shut down, the parent needs to do three things - signal every child, start a hard force-kill deadline, and wait for every tracked promise to resolve.
async function shutdownChildren(signal) {
  if (isShuttingDown) return;
  isShuttingDown = true;
  process.exitCode = 0;

  console.log("Parent got SIGTERM. Telling children to shut down...");

  // 1. Send the graceful shutdown signal to every running child.
  for (const { child } of children.values()) {
    if (isChildRunning(child)) {
      child.kill(signal);
    }
  }

  // 2. Set a hard deadline to forcefully execute surviving children.
  const forceKill = setTimeout(() => {
    for (const { child } of children.values()) {
      if (isChildRunning(child)) {
        child.kill("SIGKILL");
      }
    }
  }, 10_000);
  forceKill.unref();

  // 3. Wait for all tracked child promises to resolve.
  const results = await Promise.all(
    [...children.values()].map(({ done }) => done),
  );

  clearTimeout(forceKill);

  // If any child exited with an error, mark the parent as failed too.
  if (results.some((result) => result.error)) {
    process.exitCode = 1;
  }
}
Just like we discussed earlier, the actual signal handler needs to stay incredibly small. Its only job is to trigger this child shutdown flow and log a failure if the shutdown sequence itself crashes.
process.once("SIGTERM", () => {
  shutdownChildren("SIGTERM").catch((error) => {
    console.error("Child shutdown failed:", error);
    process.exitCode = 1;
  });
});
You shouldn't confuse the child.killed property and assume it means the child is dead. Do not make this mistake. In Node's child process API, that flag simply means child.kill() successfully sent a signal. It tells you absolutely nothing about whether the child has finished its work. You must check exitCode, signalCode, or the close event to know if the process has truly exited.
If your service spawns children, cleaning them up is a mandatory part of your graceful shutdown. You must treat child process tracking with the exact same care you give to database pools and HTTP servers. If you ignore them, your deployments will leave abandoned background tasks running outside your intended process lifecycle.
Debugging Lifecycle Issues
When things go wrong in your app - whether you are dealing with painfully slow startups, memory leaks, or a process that just refuses to shut down - do not guess. Use Node's built-in runtime diagnostics instead.
| Symptom | First probe | What to check |
|---|---|---|
| Slow startup | node --cpu-prof --cpu-prof-name=startup.cpuprofile server.js | Load the resulting profile into Chrome DevTools and look for CPU-heavy bootstrap frames holding up the line. |
| Sync I/O after startup | node --trace-sync-io server.js | Use this to catch lazy loading or accidental synchronous I/O. Note: It only starts reporting after the first event-loop turn, so it won't catch top-level sync code during initial module loading. |
| Hung shutdown | process.getActiveResourcesInfo() | Print these resource types right before shutdown is supposed to finish, then map each remaining resource type back to the subsystem that opened it. |
| Descriptor or socket leak | lsof -p <PID> | Compare the operating system's open file descriptors directly against your application's active resource tracking. |
| Sudden death | Exit code, signal, supervisor logs | Check exactly how the process died - whether it was a specific exit code, an external signal, an Out-Of-Memory (OOM) kill, a Kubernetes orchestrator timeout, or an explicit action from a parent process. |
For diagnosing steady memory growth, you need to use heap snapshots. By taking multiple snapshots over time, you can compare them to see exactly which objects are refusing to clear out of memory.
const v8 = require("node:v8");

// Hook this up to a custom Linux signal (like SIGUSR2).
// This lets you generate on-demand snapshots in production
// just by sending a signal to the process ID.
process.on("SIGUSR2", () => {
  const filename = v8.writeHeapSnapshot();
  console.log(`Heap snapshot written to ${filename}`);
});
The v8.writeHeapSnapshot() function writes a .heapsnapshot file directly to disk and returns its filename. If you need to pipe the snapshot data somewhere else (like an S3 bucket), you can use v8.getHeapSnapshot() to get a readable stream instead. Once you have the files, load them into the Chrome DevTools Memory tab, take another snapshot after simulating a load, and compare the retained objects.
We'll talk about streaming in an upcoming chapter - Streams Foundation.
When it comes to process.on("uncaughtException", ...) and process.on("unhandledRejection", ...), treat them strictly as your absolute last line of defense. Their only job is to log the error with as much detail as possible, set a failing exit code, and trigger a graceful shutdown.
Never try to keep serving traffic after an uncaught exception. At that point, the internal state of your application is completely untrustworthy. Keep these final handlers incredibly simple so they don't accidentally throw a new error while trying to report the original failure.
These core lifecycle concerns ultimately boil down to a short, repeatable set of habits and checks.
Practices to Keep
- Profile your startup time instead of guessing by running Node with the
--cpu-profflag to see exactly what is slowing down your boot sequence. - Lazy load heavy modules by moving your
require()calls inside the actual route handler if an endpoint is rarely used. - Implement a true graceful shutdown by catching
SIGTERM, refusing new requests, letting active requests finish, and only then tearing down your database connections.
// 1. Stop taking new network requests immediately
    server.close(() => {
      // 2. This callback only runs once all active requests finish draining
      // 3. Now it is safe to sever the database connection
      database.disconnect();
});- Track all active resources so that every single
createServeror databaseconnectgets a matchingcloseinstruction during your shutdown phase. - Use meaningful exit codes by reserving
0for a clean exit and using specific non-zero numbers to trigger the right alerts. - Track your child processes because if your application spawns background workers, you are completely responsible for terminating them before the main process exits.
Practices to Avoid
- Avoid blocking the event loop at startup with heavy CPU math or synchronous file reads sitting at the very top level of your files.
- Never use
process.exit()for a normal shutdown - rely onprocess.exitCodeinstead so the event loop can drain naturally and close all active handles. - Stop assuming
require()is free because every single call consumes actual CPU time and memory. - Never ignore system signals like
SIGTERM, or Kubernetes will eventually lose patience and send aSIGKILLto forcefully destroy your container. - Do not blindly trust third-party libraries to manage lifecycles cleanly. They can easily leak unreferenced handles or overwrite your custom signal handlers.
- Never ignore uncaught exceptions because they leave your application in an unpredictable, corrupted state. Log the error and shut the process down immediately.
Production Safety Checklist
Before approving a new production service, ask yourself these questions -
- Have you actively measured the application startup time?
- Do you have a clear strategy for bundling or lazy-loading heavy modules?
- Is there a fully tested handler catching
SIGTERMandSIGINT? - Can you prove that every single open connection closes cleanly during shutdown?
- Does the application report the correct exit code for both success and specific failures?
- Are you tracking and actively terminating any spawned child processes?
Node doesn't automatically know when an application is ready to receive traffic or how to clean itself up.
While Node gives you native hooks to listen for startup and shutdown events, it is entirely up to you to define the rules. Writing better production code means you must explicitly manage your startup sequence and track your active resources. You are also fully responsible for enforcing a strict shutdown order and dictating the final exit code.