Node.js Buffer Operations: Views, Copies, and Memory Ownership
Working with Buffers ultimately comes down to managing memory ownership. You can read bytes to decode them into text, write text to encode it into bytes, create a view to borrow or look at existing memory, or make a complete copy to give a specific byte range its own independent lifetime. Good Buffer code makes these decisions explicitly clear, because the Node.js runtime strictly enforces whatever ownership relationship you set up.
Working With Buffer Data
Encoding acts as the turning point where raw bytes transform into readable text, and vice versa. Calling buf.toString() decodes existing bytes, while Buffer.from(text) encodes a string down into a binary format. Once you cross over to the binary side, your primary concern shifts to whether a specific operation shares existing memory or allocates entirely new storage.
You will encounter this memory question almost immediately because Buffer's slice() method behaves completely differently from a standard array. Calling slice() on a regular JavaScript array gives you a brand-new array. Calling slice() on a Buffer simply creates a transparent window over the exact same underlying bytes. This shared memory model allows extremely fast data parsing without copying data around, but it is also a big source of accidental mutations and memory leaks.
The buf.slice() method is deprecated in favor of buf.subarray(). You still need to understand how it works, as you will frequently encounter it in legacy codebases and it perfectly shows us how memory views operate.
Like we just read, using slice() or subarray() creates a view. But, using Buffer.copy() or Buffer.from(buffer) creates a full copy of that exposed byte range.
const original = Buffer.from("Hello World");

// Creates a view. Modifying this view alters the original buffer directly.
const view = original.subarray(0, 5);

// Creates a completely independent copy. Modifying this copy is safe.
const copy = Buffer.from(original.subarray(0, 5));
Views allow you to process large payloads without the heavy performance cost of copying bytes into new memory spaces. But keeping a tiny view active can accidentally prevent the garbage collector from cleaning up a massive backing payload long after the original code has moved on. Because both Buffer and TypedArray share the exact same ArrayBuffer foundation, this ownership rule dictates how memory flows through your parsers, worker thread handoffs, and system memory profiles.
A Gigabyte-Scale Memory Leak
This specific failure almost always starts with code that looks perfectly clean. A service receives massive data chunks, extracts a tiny identifier from each chunk, and stores that identifier for later use.
A small Buffer view can accidentally keep a massive backing store alive in memory. This is not a leak in Node.js, most probably a lifetime management bug in your code. Let's suppose each incoming log batch or multipart upload chunk starts with a 16-byte session ID -
function getSessionIdView(logBuffer) {
  if (logBuffer.length < 16) {
    throw new RangeError("log buffer is missing the session id");
  }

  return logBuffer.subarray(0, 16);
}
The returned value here is just a view. The subarray() method does not allocate 16 new bytes for the session ID. Instead, it simply creates a tiny JavaScript wrapper pointing directly at the same underlying ArrayBuffer as the big logBuffer, just with a restricted byte offset and length. The older slice() method has exactly the same behavior.
If you only use that tiny view inside your current synchronous function, this arrangement is incredibly fast and efficient. But if you store that view in a cache, a Map, or a batch queue, the entire backing memory for the massive incoming chunk stays reachable through that tiny view. Even though your application only cares about those 16 bytes, the V8 garbage collector cannot free the larger buffer as long as a live view still references its backing store.
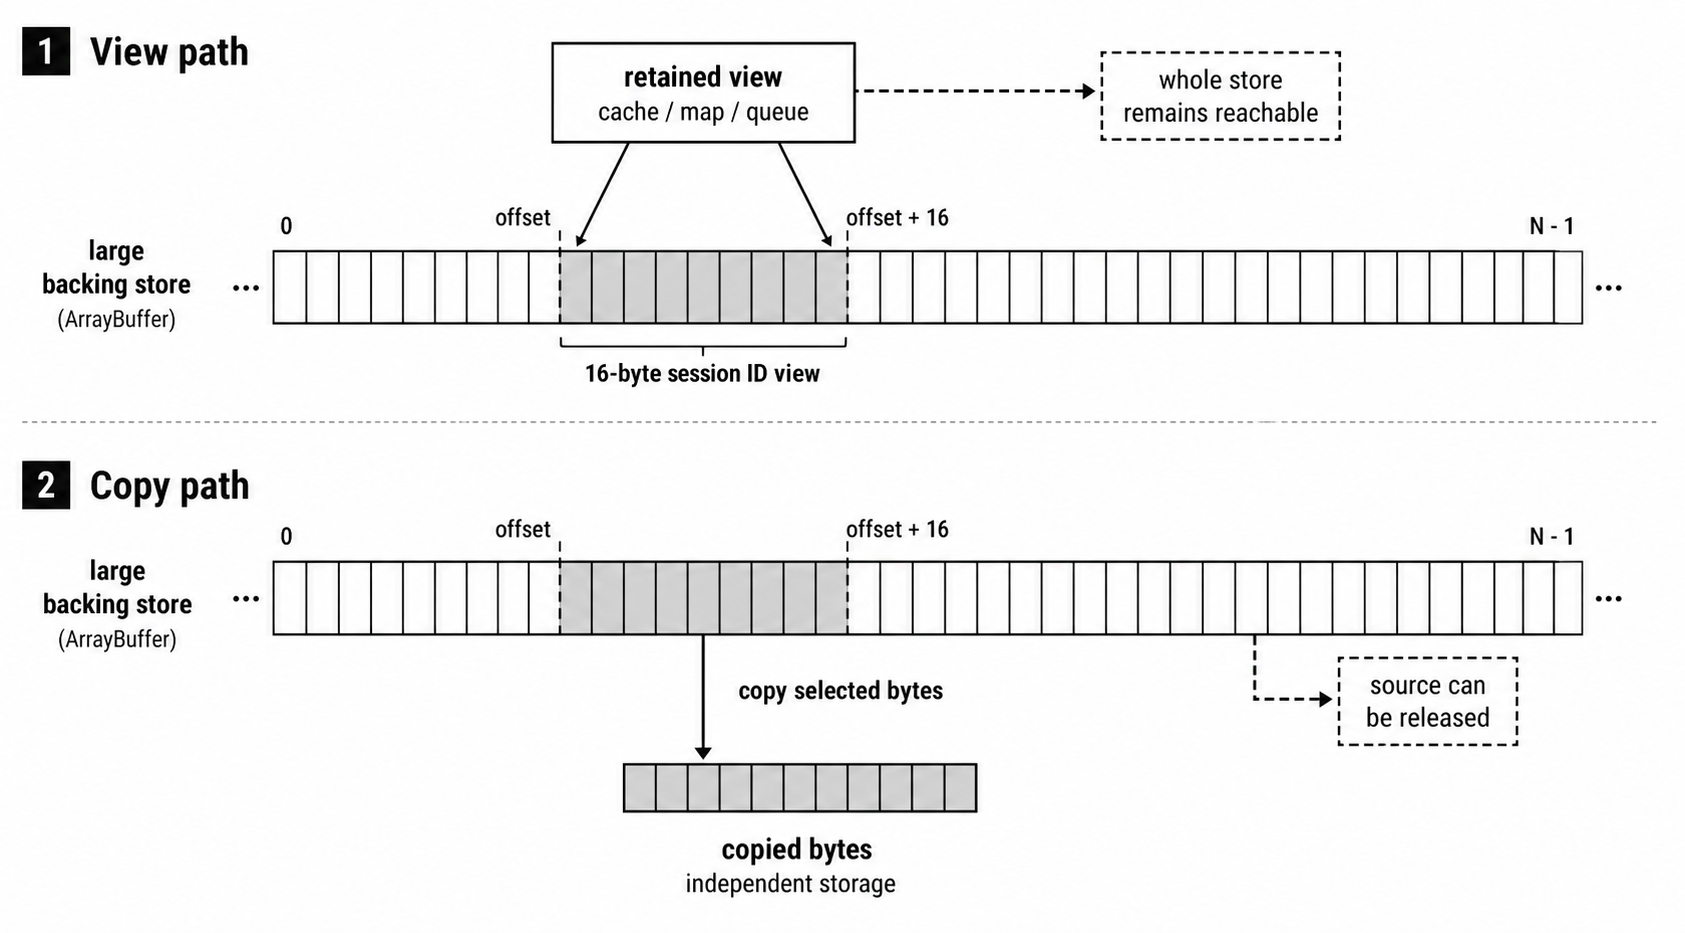
Figure 2.1 - A retained view keeps the parent backing store reachable, while a copied range can outlive the source without retaining the larger allocation.
When you take a heap snapshot to debug this, the results can look stupid at first. You might see thousands of tiny Buffer objects, but they will be holding onto these stupidly big amounts of external memory. Your profiler is fine, though. Those small wrappers are keeping the giant backing stores completely alive.
You are accidentally retaining the entire massive allocation behind every single request. Multiply that tiny mistake by thousands of stored views, and your server's memory footprint will climb far beyond what the visible JavaScript objects suggest. The root cause is a single method call where the developer misunderstood how memory ownership works.
The rule is simple. A Buffer object is a standard JavaScript object, but the actual bytes it exposes live in an ArrayBuffer that Node tracks entirely separately from normal JavaScript heap usage.
Understanding Buffer Memory Architecture
You might assume that the V8's garbage collector automatically tracks every single byte of memory their Node app uses. It actually handles memory in two completely separate buckets. V8 tracks standard JavaScript objects, while Node tracks raw binary payloads externally - usually visible when you check process.memoryUsage().external or process.memoryUsage().arrayBuffers.
The Buffer object you interact with in JavaScript is just a tiny handle sitting on the V8 heap. That handle acts as a pointer to the external backing memory where your actual bytes live. This two-part system is exactly why Buffers are so efficient for binary I/O. Node can pass massive payloads directly to native C++ code without wasting time converting them into JavaScript strings or arrays first.
This exact same separation creates a dangerous retention hazard. If your code accidentally keeps that tiny handle alive inside a closure, a cache, or a long-lived object, the entire external backing memory stays pinned down too. You are retaining the actual raw bytes that object exposes, regardless of how small the JavaScript handle looks.
The 8KB Internal Buffer Pool
Node tries to be smart about allocating memory for smaller buffers by keeping an internal, pre-allocated memory pool. By default, this pool is exactly 8KB. Whenever you request a buffer that is less than half of that size (4KB), Node might grab a slice of this shared pool instead of asking the operating system for fresh memory. Methods like Buffer.allocUnsafe(), Buffer.from(), and Buffer.concat() all dip into this pool automatically.
There is one major exception, i.e Buffer.alloc().
The Buffer.alloc() method never touches that shared internal pool. It always returns freshly initialized memory, completely zeroed out. This requires a bit more CPU work, but it guarantees you will not accidentally leak old data. On the flip side, Buffer.allocUnsafe() skips that zeroing step to run faster, meaning it hands you memory that might still contain sensitive data left over from previous requests until you explicitly overwrite it.
// Safe but slightly slower. Guarantees the memory is clean (all zeros).
// It never touches the shared internal 8KB pool.
const safeBuffer = Buffer.alloc(1024);

// Faster, but dangerous. Could contain old passwords, headers, or data left over in memory.
// It will grab memory from the shared pool if the requested size is small enough.
const riskyBuffer = Buffer.allocUnsafe(1024);
Views and References with slice, subarray, and Buffer.from
With the memory model in place, memory ownership comes down to three specific APIs - Buffer.slice(), Buffer.subarray(), and Buffer.from().
Once you start using the Buffer api in your code, the slice() method usually causes the most trouble because standard JavaScript arrays train us with the exact wrong reflex. Calling Array.prototype.slice() returns a shallow copy. You can modify the new array without touching the original. Well buffers... aren't the same.
Calling Buffer.prototype.slice() does not copy anything. It just creates a view ie. a brand new Buffer object pointing to the exact same underlying bytes as the original.
Let's look at a 50MB payload -
// Allocate a 50MB chunk of memory filled with zeroes.
const largeBuffer = Buffer.alloc(50 * 1024 * 1024);

// Encode a standard JavaScript string directly into those raw bytes.
largeBuffer.write("USER_ID:12345|REST_OF_DATA...");
Now, let's try to grab a view of just the user ID bytes.
// Grab bytes 8 through 13. No new memory is allocated here!
const userIdView = largeBuffer.subarray(8, 13);
console.log(userIdView.toString()); // Prints: 12345
No payload bytes were copied. Node just created a tiny wrapper with a different offset and length over the exact same backing store. If you write through this view, you are writing directly into the parent allocation -
// Overwrite the bytes inside the view.
userIdView.write("99999");
There is no copy-on-write protection and absolutely no warning.
console.log(largeBuffer.toString("utf-8", 0, 20));
// Prints: USER_ID:99999|REST_O
Changing userIdView permanently altered the parent buffer because both objects expose overlapping bytes inside the exact same ArrayBuffer. A modification through either reference is immediately visible through the other.
In Node, both Buffer.prototype.slice() and Buffer.prototype.subarray() create views, not copies. Node officially marks buf.slice() as deprecated because its behavior clashes with TypedArray.prototype.slice(), which actually does create a copy. You should always use subarray() in new code so nobody reading it accidentally assumes a copy is happening.
The exact same memory sharing is obvious even on a tiny scale.
const mainBuffer = Buffer.from([1, 2, 3, 4, 5]);

// Create a view covering just the values [2, 3].
const sub = mainBuffer.subarray(1, 3);

// Mutating the view mutates the original buffer.
sub[0] = 99;
console.log(mainBuffer); // Prints: <Buffer 01 63 03 04 05> (0x63 is 99 in hex)
The third API, Buffer.from(), also confuses devs because its behavior completely changes depending on exactly what input you pass into it -
| Input | Ownership behavior |
|---|---|
Buffer.from(string) | Encodes the string into a new Buffer byte range. |
Buffer.from(array) | Copies the numeric byte values into a new Buffer byte range. |
Buffer.from(arrayBuffer) | Creates a view that shares memory with the provided ArrayBuffer. |
Buffer.from(buffer) | Copies the exposed bytes from the source Buffer into a new Buffer byte range. |
Buffer.from(arrayBuffer) creates a view, but Buffer.from(buffer) actually copies the exposed bytes. Small copied Buffers might still sit inside Node's shared internal memory pool, but the copy itself is completely independent by byte range.
If you write a helper function that accepts either an ArrayBuffer or a Buffer, you need to explicitly handle the memory contract instead of blindly assuming Buffer.from(value) will treat them both the same way.
Zero-Copy Operations
People love throwing around the term "zero-copy" like it is a magic performance fix, but it hides an ownership trade-off. Sure, a zero-copy operation means Node doesn't duplicate the raw data payload. But it doesn't mean you allocated nothing. The view itself is still a full-blown JavaScript object, and that object has its own lifetime and garbage collection overhead.
Here is a quick benchmark you can throw together to compare creating a view against doing a hard copy. This setup just builds a single 10MB source buffer and targets a fixed 1KB chunk inside it.
import { performance } from "node:perf_hooks";

const largeBuffer = Buffer.alloc(10 * 1024 * 1024, 1); // 10MB memory pool
const chunkSize = 1024; // 1KB target chunk
const startOffset = 5000;
const iterations = 200_000;
let sink = 0; // Prevents V8 from optimizing away unused variables
This helper warms up the function so V8 optimizes it properly, runs the benchmark loop, and prints out the microseconds per operation.
function bench(label, fn) {
  for (let i = 0; i < 10_000; i++) sink += fn(); // Warm-up phase
  const start = performance.now();
  for (let i = 0; i < iterations; i++) sink += fn();
  const elapsed = performance.now() - start;
  const micros = ((elapsed / iterations) * 1000).toFixed(3);
  console.log(`${label}: ${micros} microseconds/op`);
}
The two test paths are identical, except one borrows the memory via a view and the other forces a complete copy.
bench("subarray view", () => {
  // Grabs a zero-copy slice pointing to the parent buffer
  return largeBuffer.subarray(startOffset, startOffset + chunkSize)[0];
});

bench("Buffer.from(view) copy", () => {
  // Allocates entirely new memory and copies the bytes over
  return Buffer.from(largeBuffer.subarray(startOffset, startOffset + chunkSize))[0];
});

console.log({ sink });
Running this code might gave me around 0.048 microseconds/op for the view and 0.276 microseconds/op for the copy. Obviously, the exact numbers depend heavily on your machine, but the real lesson here comes down to algorithmic complexity. Creating a view is always O(1) because it just moves a pointer, while copying is O(n) because it has to touch every single byte.
It's not smart if you hear "zero-copy" and instantly rewrite everything to use views. Doing that blindly trades a tiny bit of CPU work for stupidly complex memory management problems. The view is only fast because it borrows a chunk of a larger memory allocation. If you keep that tiny view alive in a cache or a queue, the massive parent buffer cannot be garbage collected.
The smart move here isn't to ban copies or abuse views everywhere. You need to look at your code and decide when the tiny CPU cost of making a clean, explicit copy is actually much cheaper than accidentally hoarding a massive parent buffer in memory forever.
Buffers, TypedArrays, and the Memory They Share
Buffers handle binary data, but they aren't some isolated thing. They belong to the TypedArray family. Ever since Node v3.0, the Buffer class has been a direct subclass of Uint8Array.
const buf = Buffer.from("hello");
// This evaluates to true because Buffer inherits directly from Uint8Array
console.log(buf instanceof Uint8Array); // true
This subclass setup is mostly for interoperability. It means you can pass a Node buffer right into any API that expects a Uint8Array, which includes a lot of the newer Web-compatible APIs built into Node. Just remember that browsers won't have Node's global Buffer object unless you bring in a polyfill or a bundler plugin.
Underneath all of these objects lies a raw byte store called an ArrayBuffer. Think of Buffer, Uint8Array, Int32Array, and all the other typed array classes as just different views looking at that exact same memory. A Buffer reads the data byte by byte. An Int32Array clumps those bytes into 4-byte groups to read them as 32-bit numbers. This flexibility goes both ways, and if your views overlap, you can easily corrupt your data without triggering a single error.
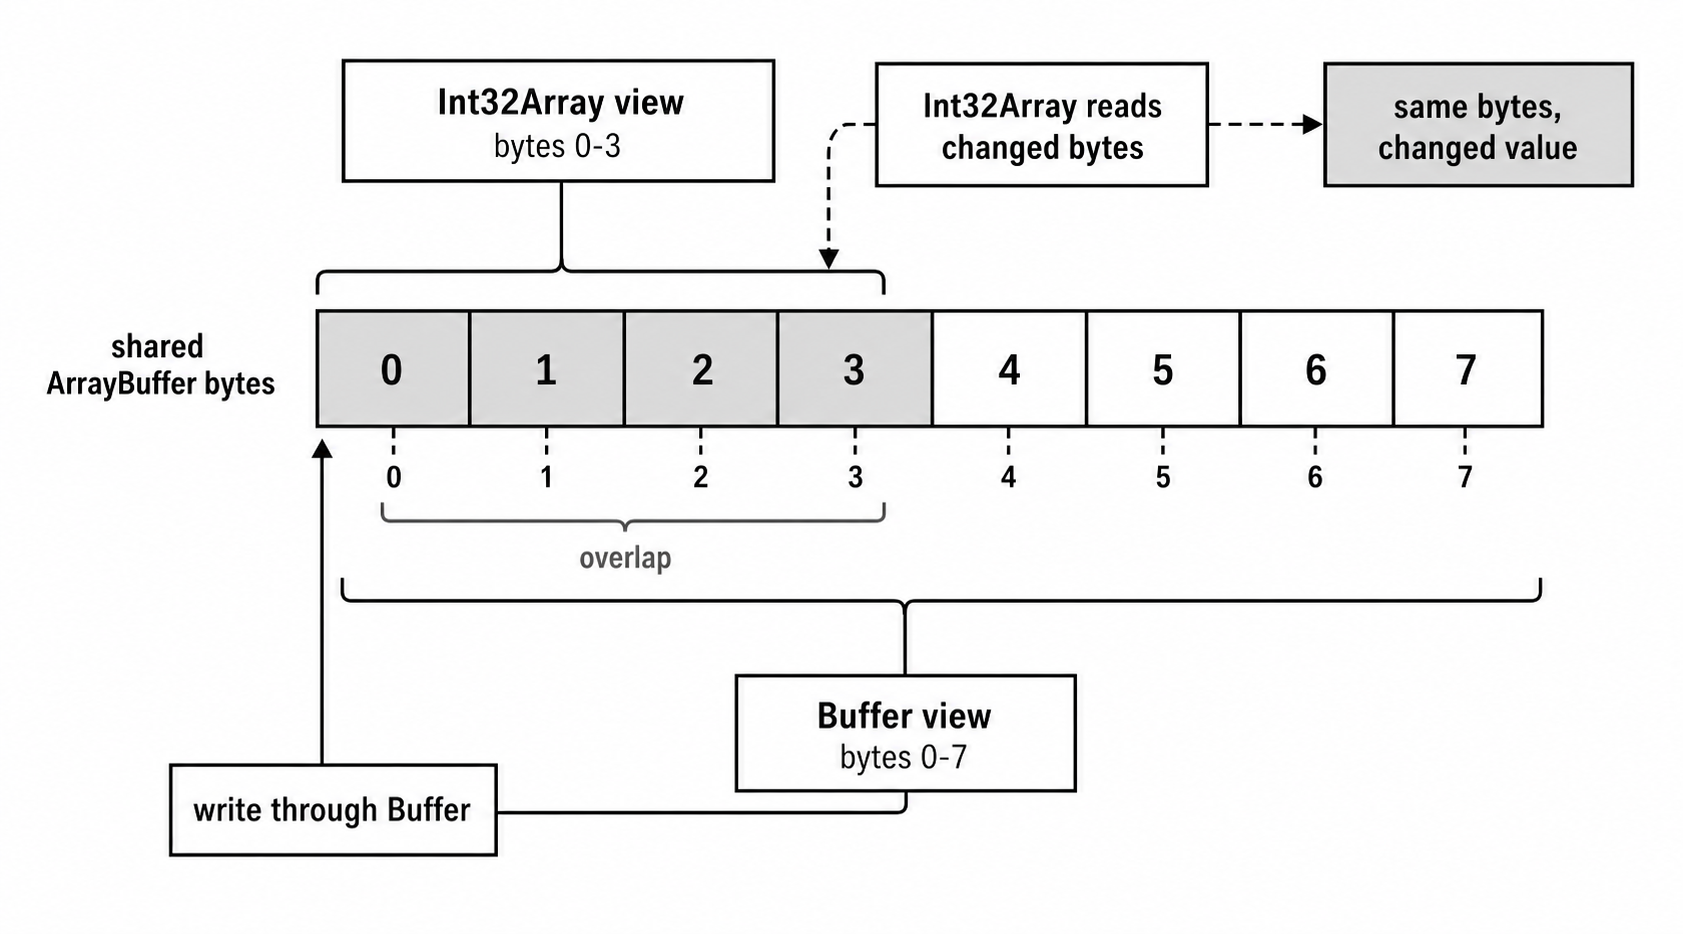
Figure 2.2 - Typed-array and Buffer views are ranges over the same byte store; when ranges overlap, a write through one view changes what the other reads.
I've already glanced over this but it's stupidly easy to forget that buf.buffer can be significantly larger than the actual bytes exposed by your buf variable. Node pools small buffers together internally to save memory. Because of this, the ArrayBuffer you get back from buf.buffer might contain completely unrelated data right before or after your buffer's specific range. Whenever you instantiate a typed array or a DataView over a buffer's backing store, you always need to pass buf.byteOffset and buf.length.
const buf = Buffer.from([0x01, 0x02]);
// Always pass the offset and length, otherwise you point to the whole internal pool
const view = new Uint8Array(buf.buffer, buf.byteOffset, buf.length);
If you blindly grab buf.buffer without those offsets, you point to the entire shared backing store instead of your specific data range. Let's look at how this breaks using a 12-byte memory allocation.
const messageArrayBuffer = new ArrayBuffer(12);You can map two different views to cover completely separate sections safely -
// A text view occupying the last 8 bytes
const stringView = Buffer.from(messageArrayBuffer, 4, 8);
stringView.write("CONFIRMD");

// An integer view occupying the first 4 bytes
const intView = new Int32Array(messageArrayBuffer, 0, 1);
console.log("Initial integer value:", intView[0]); // 0
But look what happens if you mess up the offset and cause the views to overlap -
// Buggy view starting at 0 instead of 4, stomping on the integer's territory
const buggyStringView = Buffer.from(messageArrayBuffer, 0, 8);
buggyStringView.write("CANCELED");
The script runs without failing, but writing that string completely steamrolls the integer's bytes. The raw bytes for "CANC" ([0x43, 0x41, 0x4e, 0x43]) now occupy the exact same memory slots where your number was supposed to live.
console.log("Corrupted integer value:", intView[0]);
// Prints 1129201987 on little-endian systems
The actual integer value you read back depends entirely on your system. On standard little-endian machines, that byte sequence 43 41 4e 43 gets read as 1129201987. So, when you spin up multiple views over a single ArrayBuffer, you are completely on your own for managing offsets and lengths. Node will not check your math or warn you when your views crash into each other.
When Views Share Memory (and When They Don't)
Most of the Buffer and TypedArray operations do one of two things - it either creates a view that shares memory, or it makes a copy that creates a completely independent byte range.
| Creates views | Creates copies |
|---|---|
Buffer.prototype.slice(start, end) | Buffer.alloc(size) |
Buffer.prototype.subarray(start, end) | Buffer.from(string) |
new Uint8Array(arrayBuffer, byteOffset, length) and other TypedArray constructors using an ArrayBuffer | Buffer.from(array) |
Buffer.from(arrayBuffer, byteOffset, length) | Buffer.from(buffer) |
Buffer.prototype.copy() into an existing buffer | |
Uint8Array.prototype.slice(start, end) |
These zero-copy tools are great when you need to look at a temporary slice of your data. The trick is keeping them temporary. If a view disappears quickly, you get the performance win without any memory risk. But if that view slips into a long-lived object, it drags the entire original backing store along with it.
Since Buffer inherits from Uint8Array, the behavior of slice() gets a bit weird. If you force Node to run the standard Uint8Array slice method on a buffer - using Uint8Array.prototype.slice.call(buf, ...) - you actually get a copy instead of a view. This quirk is why you should always use subarray() when you explicitly want a view.
You can see this lifetime issue clearly when you read a giant file but only plan to keep a tiny bit of metadata -
import { readFileSync } from "node:fs";

// Blocks the thread to read the whole file into memory.
// (Don't do this inside a real HTTP request path).
const videoBuffer = readFileSync("large-video.bin");
Now, look what happens when you grab just the first KB -
// Creates a window into the original buffer without allocating new memory
const metadataView = videoBuffer.subarray(0, 1024);
This is just a tiny view pointing at the exact same memory as videoBuffer. If you push metadataView into a cache, a global variable, or some long-lived object, that giant file buffer stays trapped in memory for just as long.
If that metadata needs to stick around, you have to force a clean break and make a real copy -
// Clones just those 1024 bytes into a completely fresh, independent buffer
const metadataCopy = Buffer.from(videoBuffer.subarray(0, 1024));
Because Buffer.from(buffer) clones the bytes into an independent memory range, metadataCopy drops its connection to the original file buffer. Now the garbage collector can safely dump the giant video file while you keep the metadata.
You just have to ask yourself a question about its' lifetime - how long does this data need to live? If you are just processing bytes quickly inside a single function, views are perfect. But if you need to store, cache, or pass that data around your app, make an explicit copy so it owns its own memory. Here’s the rewritten version in the improved style we discussed. I kept the facts and structure intact, but tightened the language, removed slang/metaphors, and made the explanation feel more like a strong technical mentor walking the reader through the decisions.
Here’s the updated version -
Copy Semantics and Buffer.copy()
When you need an independent copy of your data instead of another reference to shared memory, Buffer.prototype.copy() is the API you use to write bytes into an existing destination buffer. The syntax follows the pattern below -
buf.copy(targetBuffer, targetStart, sourceStart, sourceEnd);Since copy() writes into a target buffer you provide, you need to allocate that destination first -
// Allocate a 26-byte source buffer from a string.
const source = Buffer.from("abcdefghijklmnopqrstuvwxyz");

// Allocate a fresh, initialized 10-byte target buffer.
const target = Buffer.alloc(10);
The string is encoded into 26 bytes of UTF-8. Since these are basic ASCII characters, each character uses exactly one byte. Now you can copy part of the source buffer into the target buffer -
// Copy the first 10 bytes from source into target starting at index 0.
source.copy(target, 0, 0, 10);
console.log(target.toString()); // Output: 'abcdefghij'
After the copy, the two buffers are independent by byte range. Changing the source does not affect the target, and changing the target does not affect the source. You can also use copy() to overwrite a specific range inside an existing buffer -
// Copy 5 bytes from source, indices 10 through 14,
// into target starting at index 3.
source.copy(target, 3, 10, 15);
console.log(target.toString()); // Output: 'abcklmnoij'
Buffer.copy() is useful because it avoids a manual byte-by-byte loop in JavaScript. The cost still scales with the number of bytes being copied, but the operation itself is handled by Node’s native Buffer implementation. To clone an entire Buffer in one step, use Buffer.from(buffer) -
const original = Buffer.from("This is the original buffer");

// Creates an independent copy of the bytes exposed by original.
const clone = Buffer.from(original);
This copies the bytes exposed by original into a new Buffer. If you overwrite part of the clone, the original stays unchanged -
clone.write("That");
console.log(original.toString()); // Output: 'This is the original buffer'
console.log(clone.toString());    // Output: 'That is the original buffer'
For small Buffers, Node may place both Buffers inside the same internal pooled allocation. That does not mean their exposed byte ranges are shared. The guarantee is that writes to one Buffer’s exposed bytes do not modify the other Buffer’s exposed bytes.
You should use Buffer.from(buffer) when you want to allocate and copy in one step and Buffer.copy() when you already have a destination Buffer and want to write bytes into it deliberately.
This is the fix for the memory retention bug from earlier. If a small byte range needs to live longer than a much larger source Buffer, copy that range so it no longer references the larger backing store. The common pattern is to create a temporary view with subarray(), then pass that view into Buffer.from() -
function getSessionId(logBuffer) {
  if (logBuffer.length < 16) {
    throw new RangeError("log buffer is missing the session id");
  }

  // subarray() creates a temporary view.
  // Buffer.from() copies only those 16 exposed bytes.
  const sessionId = Buffer.from(logBuffer.subarray(0, 16));
  return sessionId.toString("utf-8");
}
Now the returned session ID no longer depends on the larger logBuffer allocation. Once logBuffer is no longer reachable, its backing store can be reclaimed by the garbage collector.
When handling security-sensitive data, follow these rules carefully -
- Use
Buffer.alloc()for entirely new initialized allocations. - Use
Buffer.from(sourceBuffer)when you want an independent copy of an existing byte range. - Do not treat
Buffer.from(arrayBuffer)as a copy. It creates a shared view instead. - Use
Buffer.allocUnsafe()only when you will immediately overwrite the entire Buffer before anything reads from it.
Copying costs more CPU work than creating a view. In return, it gives the copied byte range its own lifetime. That trade-off is often worth it when the alternative is keeping a much larger source allocation reachable by accident.
Worker Threads and SharedArrayBuffer
Worker threads add another memory ownership decision. Node can clone data between workers, transfer ownership of certain buffers, or share memory explicitly.
A regular ArrayBuffer is not automatically shared. If you send it to a worker without a transfer list, the data is cloned. If you include the ArrayBuffer in the transfer list, ownership moves to the receiver and the sender’s ArrayBuffer becomes detached.
A SharedArrayBuffer behaves differently. It lets multiple threads create views over the same shared memory.
When you're working with Node's worker threads, use SharedArrayBuffer only when you deliberately want shared mutable memory. Use Atomics for cross-thread coordination. Regular indexed reads and writes are not a synchronization protocol. Don't worry, we have a lot of upcoming subchapters that go into much much more details about Atomics.
The view rules stay the same. A TypedArray or Buffer view over a SharedArrayBuffer does not own independent bytes. It exposes shared bytes, and writes from one thread can be observed by another thread. Main-thread snippet -
const sab = new SharedArrayBuffer(4);
const mainView = new Int32Array(sab);

Atomics.store(mainView, 0, 123);
// worker.postMessage({ sab });
Worker snippet -
import { parentPort } from "node:worker_threads";

parentPort.on("message", ({ sab }) => {
  const workerView = new Int32Array(sab);
  console.log(Atomics.load(workerView, 0)); // 123
  Atomics.store(workerView, 0, 456);
  parentPort.postMessage("done");
});
Atomics provides atomic reads, writes, and read-modify-write operations for integer typed-array views backed by shared memory. It does not make a full cross-thread protocol correct by itself. It gives you the low-level operations needed to build one safely.
Be careful with Buffers and transfer lists. In Node v24, backing stores used by the internal Buffer pool are marked untransferable. If you put a pooled Buffer’s buffer in a transfer list, postMessage() throws DataCloneError. If you send it without a transfer list, the data is cloned, and that clone can include the whole 8KB pool instead of only the small Buffer range you intended to send.
Buffer.alloc() returns initialized memory outside the internal pool, so its ArrayBuffer can be transferred and detached in current Node. Small Buffers created through pooled paths, such as Buffer.from("x"), have different ownership behavior. If a worker only needs a small byte range, copy that exact range first and send the copied range intentionally.
The same rule applies across worker boundaries: views do not own independent bytes. With SharedArrayBuffer, that rule applies across threads too.
Memory Retention and Garbage Collection
Memory retention follows reachability. In a garbage-collected language like JavaScript, an object stays in memory as long as it can still be reached from the root set. The root set includes the global object, active stack frames, closures, and live data structures.
For a Buffer view, the relationship has two parts -
| Part | What it is |
|---|---|
| View object | The new Buffer instance, with its own offset and length. |
| Backing store | The underlying ArrayBuffer or external memory containing the bytes. |
A view keeps its backing store reachable. The original Buffer wrapper may not be the object that explains the memory retention in a heap snapshot. The retained resource is often the larger backing memory. The runtime cannot know that your application only cares about 16 bytes inside a 50MB allocation.
This is why the heap snapshot from the earlier retention bug can look confusing at first. The profiler may show many small Buffer objects with small shallow sizes, while the retained size points to much larger backing memory.
| Size | Meaning |
|---|---|
| Shallow size | The size of the object itself. For a Buffer view, this is the wrapper object, not the full byte payload. |
| Retained size | The amount of memory kept reachable because this object exists. For long-lived views, this can include much larger backing memory. |
The fix is to remove the reference relationship between the small byte range you need and the larger backing store. You do that by copying the bytes. This version returns a view -
function createView(parent) {
  return parent.subarray(0, 10);
}
That view still references parent’s backing memory. If parent is 10MB, retaining the 10-byte view can retain the 10MB backing store. The copied version breaks that relationship -
function createCopy(parent) {
  return Buffer.from(parent.subarray(0, 10));
}
The Buffer.from(buffer) call copies the bytes exposed by the temporary view. Small copies may still use Node’s internal pool, but the returned Buffer no longer references the large parent backing store. This pattern is common in Buffer-heavy code -
Buffer.from(buf.subarray(start, end));It creates a trimmed copy of a specific byte range from a larger Buffer.
Binary Protocol Parsing with Views
Binary protocols are common when wire size, parsing cost, or fixed field layout matters. A protocol defines how data is arranged inside a sequence of bytes. For example, a message might use this layout -
| Range | Field |
|---|---|
| Bytes 0-1 | Message Type (Uint16) |
| Bytes 2-3 | Message Length (Uint16) |
| Byte 4 | Flags (Uint8) |
| Bytes 5-20 | Session ID, a 16-byte binary value |
| Bytes 21-end | Payload, raw bytes |
A simple parser might create temporary views even for fields that can be read directly by offset -
function parseMessageWithTemporaryViews(buffer) {
  if (buffer.length < 21) throw new RangeError("message is shorter than the fixed header");

  const messageType = buffer.subarray(0, 2).readUInt16BE(0);
  const messageLength = buffer.subarray(2, 4).readUInt16BE(0);
  const flags = buffer.subarray(4, 5).readUInt8(0);
  const sessionIdHex = buffer.subarray(5, 21).toString("hex");
  const payload = buffer.subarray(21);
  return { messageType, messageLength, flags, sessionIdHex, payload };
}
This code works, but it creates temporary Buffer views just to read primitive number fields. At high message rates, those extra wrapper objects create avoidable garbage-collection pressure.
This parser returns a payload view. If callers retain those views for about one second while processing 1000 messages per second with 1MB payloads, they can retain roughly 1000MB of backing memory.
A tighter parser reads primitive fields directly from the main buffer by offset. It only returns views for fields whose bytes the caller may need to inspect -
function parseMessageWithViews(buffer) {
  if (buffer.length < 21) throw new RangeError("message is shorter than the fixed header");

  const messageType = buffer.readUInt16BE(0);
  const messageLength = buffer.readUInt16BE(2);
  const flags = buffer.readUInt8(4);
  const sessionIdView = buffer.subarray(5, 21);
  const payloadView = buffer.subarray(21);
  return { messageType, messageLength, flags, sessionIdView, payloadView };
}
This version creates no intermediate views for the primitive number fields. It creates two views, one for the session ID and one for the payload. No payload bytes are copied.
This zero-copy version returns views that retain the message backing store. Document that contract clearly. Callers must copy returned views if they need to store them beyond the immediate processing scope.
Use views when processing is temporary. If sessionIdView or payloadView needs to be stored, sent across a different ownership boundary, or kept after the source message should be releasable, copy it before storing.
A parser can return views as a deliberate contract. The caller then decides whether the returned data is short-lived enough to use directly or long-lived enough to copy.
Platform Endianness and TypedArray Views
Endianness is the byte order used to store a multi-byte number, such as a 16-bit or 32-bit integer. The two byte orders you will see most often are -
| Order | Meaning |
|---|---|
| Big-endian (BE) | The most significant byte comes first. Network protocols often use this order, so 0x12345678 is stored as 12 34 56 78. |
| Little-endian (LE) | The least significant byte comes first. Most modern CPUs, including Intel and AMD x86-64, use this order, so 0x12345678 is stored as 78 56 34 12. |
If you ignore endianness, you can read the wrong values from binary protocols. Node.js's Buffers provide explicit methods for this, such as readUInt16BE, readUInt16LE, writeInt32BE, and the related read/write methods. These are usually the clearest APIs when you know the byte order of the data you are parsing.
TypedArray views add one more detail - they use native byte order. Typed arrays such as Int16Array and Float64Array read and write values using the host system’s native endianness. On common x86-64 systems, that is little-endian. If you create an Int16Array view over bytes that represent big-endian network data, you will read the wrong value. Here, the Buffer method reads the value explicitly as big-endian -
const networkBuffer = Buffer.from([0x01, 0x02]);
console.log(networkBuffer.readUInt16BE(0)); // 258
The readUInt16BE() method handles byte order explicitly. It treats byte 0 as the high byte and byte 1 as the low byte, regardless of the platform’s native endianness. The typed-array view uses the platform’s native byte order instead -
const int16View = new Int16Array(networkBuffer.buffer, networkBuffer.byteOffset, 1);
console.log(int16View[0]); // 513 on little-endianTypedArray views use platform endianness. Network protocols often use big-endian. Use Buffer’s BE/LE methods or DataView with explicit endianness when parsing externally defined binary formats.
Use DataView when generic ArrayBuffer code needs explicit byte order. A DataView reads and writes values in an ArrayBuffer and lets you specify endianness for each operation -
const arrayBuffer = new ArrayBuffer(4);
const dataView = new DataView(arrayBuffer);

dataView.setInt32(0, 123456789, false);
The setInt32() call with false writes the bytes as [0x07, 0x5b, 0xcd, 0x15], with the most significant byte first. DataView uses the byte order specified by the boolean argument you pass -
console.log(dataView.getInt32(0, true));  // 365779719
console.log(dataView.getInt32(0, false)); // 123456789
When parsing binary data with a defined byte order, be explicit. Use Buffer’s BE and LE methods, or use a DataView.
Production Patterns for Zero-Copy
These patterns keep Buffer ownership decisions visible in production code.
Pattern 1 - Temporary Views for Synchronous Processing
The safest use of zero-copy views is processing part of a larger Buffer inside a single synchronous scope -
function processChunk(largeBuffer, offset, length, calculate) {
  if (offset < 0 || length < 0 || offset + length > largeBuffer.length) {
    throw new RangeError("chunk range is outside the buffer");
  }

  const view = largeBuffer.subarray(offset, offset + length);
  return calculate(view);
}
Use this pattern only when calculate() consumes the view synchronously and does not store or return it. If the callback returns the view, stores it in a collection, or starts async work that uses it later, the view has escaped the intended scope. At that point, it can retain or observe the parent backing store longer than expected.
If the data needs to be stored long-term or passed to code with a different lifetime, copy it instead.
Pattern 2 - Defensive Copies for Asynchronous Operations and Storage
Whenever Buffer data crosses an asynchronous boundary or gets stored in a collection, check its ownership. A retained view keeps the source backing store alive. The original owner may also mutate or reuse the source Buffer. The defensive copy pattern looks like this -
const longLivedCache = new Map();

function processAndCache(dataBuffer) {
  if (dataBuffer.length < 16) throw new RangeError("data buffer is missing the key");

  const key = dataBuffer.subarray(0, 16);
  const value = dataBuffer.subarray(16);
  longLivedCache.set(key.toString("hex"), Buffer.from(value));
}
The views here are temporary parsing aids. Once value is stored in longLivedCache, it becomes an independent copy. The key is converted to a string, which is also independent of the original Buffer bytes. The cache entry is now self-contained and does not retain the larger dataBuffer.
Pattern 3 - Parser Contracts with Views
Library code can return views, but that contract must be explicit. Returned views reflect later mutations to the original buffer and retain its backing memory. The caller must decide whether to copy -
/**
 * Parses a message header from a buffer.
 * WARNING: Returned values are views; copy before storing.
 * @returns {{id: Buffer, body: Buffer}} Views for id and body.
 */
function parseHeader(buffer) {
  if (buffer.length < 8) throw new RangeError("buffer is shorter than the header");

  return { id: buffer.subarray(0, 8), body: buffer.subarray(8) };
}
The comment tells callers exactly what kind of ownership they receive. A caller that needs to store the ID should copy it -
const rawMessage = Buffer.alloc(32);
const { id, body } = parseHeader(rawMessage);

const savedId = Buffer.from(id);
console.log(body.length);
Callers who can process the data immediately avoid copies. Callers who need to store the data make ownership explicit by copying.
Debugging Memory Issues with Views
When you suspect a view-related memory retention bug, the heap snapshot is the primary tool. You can generate snapshots with Chrome DevTools for Node.js, the built-in node:v8 writeHeapSnapshot() API, or packages such as heapdump.
A practical debugging flow looks like this -
- Take a heap snapshot while the application is stable and using a normal amount of memory.
- Apply the load that you believe triggers the memory growth.
- Take a second heap snapshot.
- Take a third snapshot later to confirm whether the growth continues.
In the snapshot viewer, use the Comparison view to inspect what was allocated between snapshots. For Buffer retention bugs, look for many small Buffer views that keep large backing stores reachable.
Chrome DevTools with node --inspect-brk can inspect retained size and retaining paths. The exact labels vary across DevTools and V8 versions, but the relationship you are looking for is consistent. A small Buffer view can keep a much larger backing allocation reachable.
Another useful signal is process.memoryUsage(). In Node.js v13.9 and v12.17+, process.memoryUsage().arrayBuffers tracks memory allocated for ArrayBuffers and SharedArrayBuffers, including Node.js Buffers. This value is also included in external.
If heapUsed is stable but arrayBuffers, external, or rss keeps growing, investigate retained Buffer views, large Buffers, or allocator fragmentation before assuming normal JavaScript object growth. external and rss may also remain high after objects become unreachable because allocator behavior is separate from JavaScript reachability.
Metrics tell you that memory is growing. Heap snapshots show the reference chain that keeps the backing memory reachable.
Best Practices for Buffer Manipulation
Use this checklist when writing Buffer-heavy code -
- Use views for temporary, synchronous processing.
- Use explicit copies for data that is long-lived, cached, or handed to code with a different lifetime.
- Document functions that return views.
- Treat
slice()orsubarray()assigned to an object property, closure, cache, or module-level variable as a review point. - Profile memory behavior under representative load, not just functional correctness.
- Ask two questions for every zero-copy operation: how long will the view live, and how long should the source backing store live?
Memory Profiling Data
Use a small script when you want to demonstrate the retention behavior on your own machine. Run it with node --expose-gc buffer-retention.mjs so the script can request garbage collection between snapshots. Start with the garbage collection guard and formatting helper -
if (typeof global.gc !== "function") {
  throw new Error("Run with: node --expose-gc buffer-retention.mjs");
}

function mb(bytes) {
  return `${(bytes / 1024 / 1024).toFixed(1)} MB`;
}
The snapshot helper forces a collection, then prints the memory categories relevant to Buffer backing stores -
function snapshot(label) {
  global.gc();
  const memory = process.memoryUsage();
  console.log(label, {
    heapUsed: mb(memory.heapUsed),
    arrayBuffers: mb(memory.arrayBuffers),
    external: mb(memory.external),
    rss: mb(memory.rss),
  });
}
The first allocation path keeps many views into one large Buffer -
function makeViews() {
  let large = Buffer.alloc(50 * 1024 * 1024, 1);
  const views = [];

  for (let i = 0; i < 100_000; i++) views.push(large.subarray(0, 10));
  large = null;
  return views;
}
The second path copies the same 10-byte range each time -
function makeCopies() {
  let large = Buffer.alloc(50 * 1024 * 1024, 1);
  const copies = [];

  for (let i = 0; i < 100_000; i++) copies.push(Buffer.from(large.subarray(0, 10)));
  large = null;
  return copies;
}
Running both paths shows how the retained memory differs -
snapshot("start");
let views = makeViews();
snapshot("views retained");
views = null;
snapshot("views released");

let copies = makeCopies();
snapshot("copies retained");
console.log("sample copy backing store bytes:", copies[0].buffer.byteLength);
copies = null;
snapshot("copies released");
Sample output from Node.js v24.15 on Linux x64 -
start {
  heapUsed: '3.6 MB',
  arrayBuffers: '0.0 MB',
  external: '1.4 MB',
  rss: '69.8 MB'
}
views retained {
  heapUsed: '14.7 MB',
  arrayBuffers: '50.0 MB',
  external: '51.6 MB',
  rss: '144.2 MB'
}
views released {
  heapUsed: '3.9 MB',
  arrayBuffers: '0.0 MB',
  external: '51.6 MB',
  rss: '95.4 MB'
}
copies retained {
  heapUsed: '14.8 MB',
  arrayBuffers: '1.5 MB',
  external: '53.1 MB',
  rss: '115.5 MB'
}
sample copy backing store bytes: 8192
copies released {
  heapUsed: '4.0 MB',
  arrayBuffers: '0.0 MB',
  external: '3.1 MB',
  rss: '112.5 MB'
}
The exact numbers will vary by Node version, operating system, allocator behavior, and machine. The important pattern is stable: retained views keep the 50MB backing store visible in arrayBuffers; retained copies do not. Notice that the small copies in this run use pooled backing stores, shown by the 8192 byte backing store size. They do not each get a unique 10-byte ArrayBuffer.
The Trade-Off
Copying everything makes ownership easier to reason about, but it can waste CPU and memory in hot paths. Returning views is fast and allocation-friendly, but only when the view lifetime matches the source lifetime.
Shared backing memory has clear benefits, but it also requires explicit lifetime management. When you create a view, you are deciding that the view and the backing memory can safely remain connected for the same amount of time.
When you see code like this -
const view = buf.subarray(0, 10);the review question should be specific - how long will this view live, and what backing memory does it keep reachable? If those lifetimes do not match, make a copy.