Node.js os Module: CPU, Memory & Network Interfaces
The node:os module gives your program a way to ask, "What kind of machine am I running on?"
process tells you about the current Node process. os tells you about the host around that process. If you want to know how much memory the machine has, how many CPU threads the process can use, what network interfaces exist, what platform you are on, or where the temporary directory lives, this module is the built-in place to start.
It does not give you full control over the operating system. Most of it is read-only. You are asking the host for information, not changing the host.
The os Module
Import it like any other built-in Node module -
const os = require('node:os');Most os values are readings taken at the moment you call the function. That small detail is easy to miss, but it affects how you use the module.
The host is always changing. Free memory changes as other processes allocate and release memory. Network interfaces can appear or disappear when Wi-Fi, VPNs, Docker, or container networking changes. CPU limits can be different inside a container than on the physical host. So values from os should usually be treated as fresh readings, not permanent facts about the process.
For example, this can return two different numbers one second apart -
console.log(os.freemem());

setTimeout(() => {
  console.log(os.freemem());
}, 1000);
That does not mean anything strange happened in Node. It means memory availability is a system-level value, and the rest of the machine kept running between your two calls.
Under the hood, many functions in node:os go through libuv. libuv then calls the right platform API for Linux, macOS, Windows, and other supported systems. That is why the JavaScript API looks small and clean, even though the operating systems underneath all expose this data differently.
You will usually use this module for three kinds of work -
| Use case | Examples |
|---|---|
| Capacity decisions | CPU count, available parallelism, memory totals |
| Runtime diagnostics | hostname, platform, architecture, load average |
| Environment-aware paths | home directory, temporary directory, network addresses |
The rest of this chapter walks through those groups from the most common production values down to the platform details behind them.
CPU Information
os.cpus() returns one entry for each logical CPU that the operating system reports -
const cpus = os.cpus();

console.log(cpus.length);
console.log(cpus[0]);
One entry looks like this -
{
  model: 'Apple M1 Pro',
  speed: 2400,
  times: {
    user: 483200,
    nice: 0,
    sys: 198300,
    idle: 2918400,
    irq: 0
  }
}
The model string comes from the operating system. The speed value is the reported clock speed in MHz. The times object is usually the most useful part. It tells you how long that logical CPU has spent in different states since the machine booted.
Here is what those fields mean -
| Field | Meaning |
|---|---|
user | Time spent running user-space code, including your app and Node itself. |
sys | Time spent in kernel work such as syscalls, scheduling, drivers, and context switches. |
idle | Time when the CPU had no work to run. |
nice | Time spent running lower-priority user-space processes. On Windows, this is always 0. |
irq | Time spent handling hardware interrupts, such as network packets or disk completion events. |
The word "logical" is doing real work here. A machine with 8 physical cores and hyperthreading can report 16 logical CPUs. The OS schedules work onto those 16 hardware threads, even though pairs of them share execution resources on the same physical core.
That means os.cpus().length is not always the same as physical core count.
Apple Silicon has its own layout. M-series chips have performance cores and efficiency cores, and they do not use hyperthreading. An M1 Pro with 8 performance cores and 2 efficiency cores reports 10 entries. The array still contains logical CPUs, but the hardware behind those entries is different from a hyperthreaded x86 machine.
The speed field also needs a little caution. Modern CPUs change frequency constantly. Intel Turbo Boost and AMD Precision Boost can push a chip far above the base clock under load, while power saving can reduce frequency when idle. os.cpus() reports what the platform gives Node, not a live per-core frequency meter.
On Apple Silicon, the reported speed usually reflects the performance-core frequency. Efficiency cores run slower, but this API does not report different speeds for different core types. Treat speed as a rough descriptor, not a live performance measurement.
Calculating CPU Usage
A single os.cpus() call gives you totals since boot. That is useful, but it does not answer, "How busy is the CPU right now?"
For current CPU usage, take two readings and compare them. The difference between the readings tells you what happened during that time window.
Start with a helper that averages idle time and total time across all logical CPUs -
function cpuAverage() {
  const cpus = os.cpus();

  let idle = 0;
  let total = 0;

  for (const { times } of cpus) {
    idle += times.idle;
    total += times.user + times.nice + times.sys + times.idle + times.irq;
  }

  return {
    idle: idle / cpus.length,
    total: total / cpus.length
  };
}
Now take one reading, wait a bit, then take another reading -
const start = cpuAverage();

setTimeout(() => {
  const end = cpuAverage();

  const idleDiff = end.idle - start.idle;
  const totalDiff = end.total - start.total;
  const usage = 100 - (idleDiff / totalDiff) * 100;

  console.log(`CPU usage: ${usage.toFixed(1)}%`);
}, 1000);
The math is straightforward. Total time includes both busy time and idle time. If idle time went up a lot, the CPU was mostly idle. If idle time barely moved while total time increased, the CPU was busy.
A one-second interval is fine for dashboards. A five-second interval is often better for alerts because it smooths out tiny spikes that disappear immediately.
Averages can hide single-threaded problems. If one core is pinned at 100% and fifteen cores are idle, the average on a 16-core machine looks low. That is why per-core numbers are useful when debugging uneven work distribution.
Here is a helper that calculates usage for each logical CPU separately -
function perCoreDelta(prev, curr) {
  return curr.map((cpu, i) => {
    const previous = prev[i].times;
    const current = cpu.times;

    const idle = current.idle - previous.idle;

    const total =
      current.user + current.sys + current.idle + current.nice + current.irq -
      (previous.user + previous.sys + previous.idle + previous.nice + previous.irq);

    return ((1 - idle / total) * 100).toFixed(1);
  });
}
That gives you an array of percentages. It helps when a workload is stuck on one thread, when work is not spreading evenly, or when the app cannot actually use the parallelism the machine has.
os.availableParallelism()
os.availableParallelism() tells you how much parallel work the current process should assume it can use.
That sounds close to os.cpus().length, but the two values can be very different.
Here is the kind of result you might see inside a container -
os.availableParallelism(); // 4
os.cpus().length;          // 64
The host machine has 64 logical CPUs, but this process is only allowed to use 4 CPUs worth of work. That difference is common in containers.
os.cpus().length describes the host CPU inventory. os.availableParallelism() follows the CPU scope available to this process. If cgroups, CPU quotas, or affinity rules limit the process, availableParallelism() gives you the smaller number.
That is the number you usually want when sizing CPU-bound workers.
A container with a 2-CPU quota should not start 64 CPU-heavy workers just because the host has 64 logical CPUs. Those workers will compete for the same small CPU budget. More workers can make the app slower because the OS spends more time switching between them.
The same idea applies to libuv's thread pool. The default UV_THREADPOOL_SIZE is 4. That can be fine on a normal server, but it may be too much inside a tiny one-CPU container, depending on the workload.
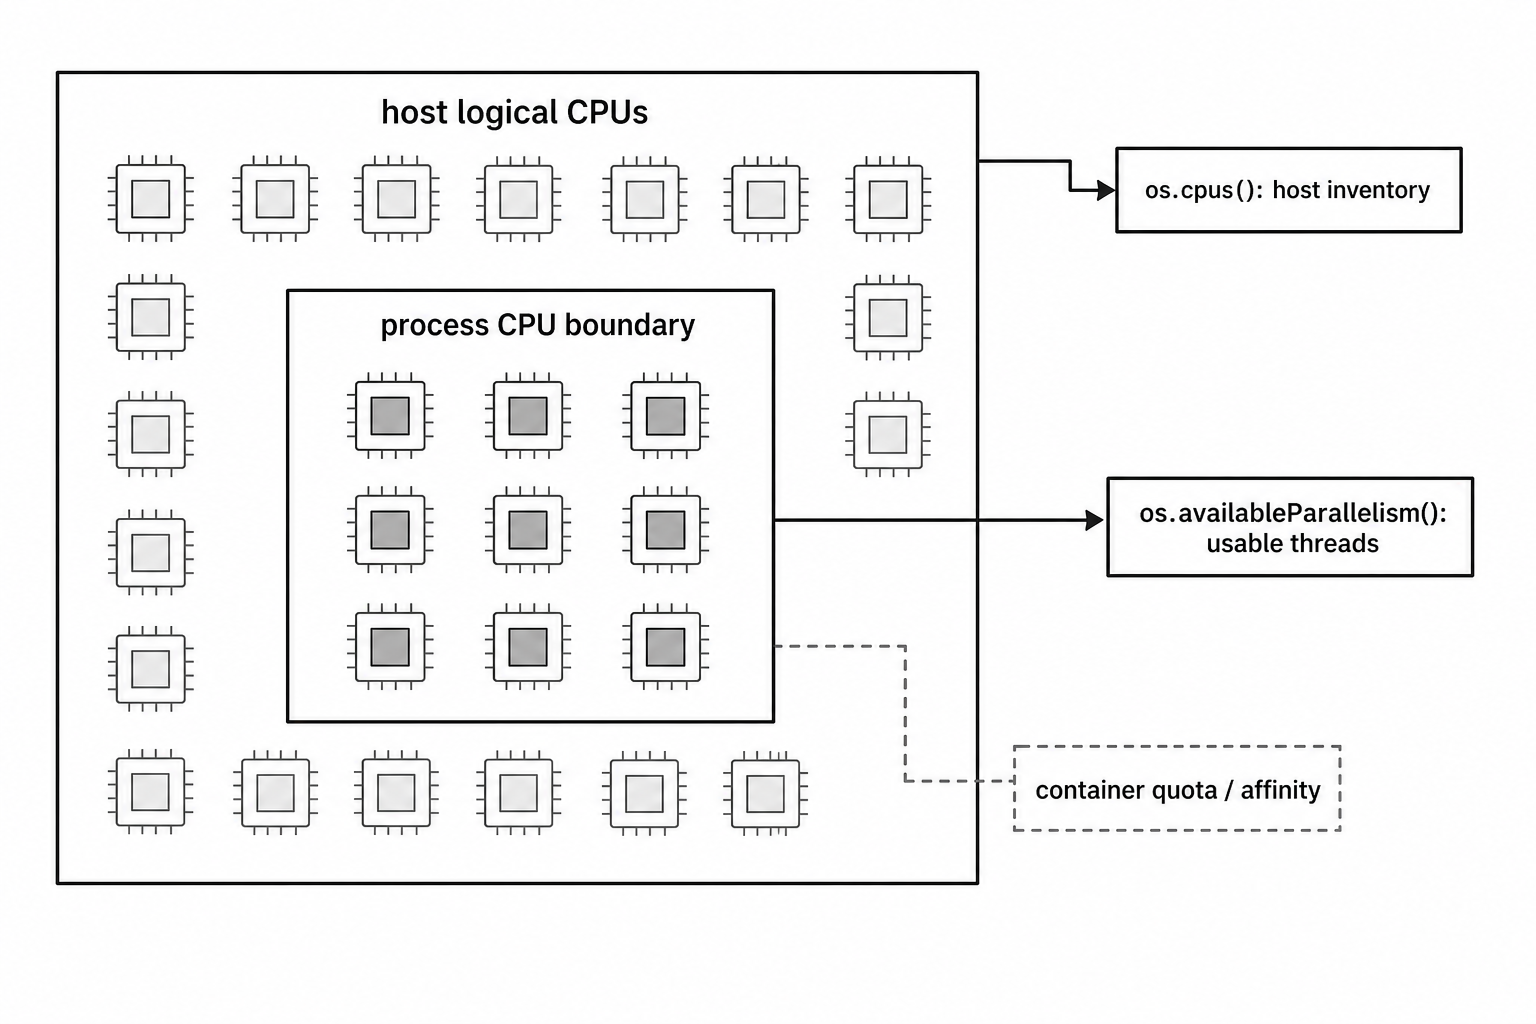
Figure 5.1 - os.cpus() describes the host CPU inventory. os.availableParallelism() follows the CPU scope available to the current process. Inside containers, that scope can be much smaller than the host.
Internally, Node calls libuv's uv_available_parallelism().
On Linux, libuv checks container CPU limits first. For cgroups v2, it reads /sys/fs/cgroup/cpu.max. For cgroups v1, it reads /sys/fs/cgroup/cpu/cpu.cfs_quota_us. If those do not give a limit, it can fall back to CPU affinity with sched_getaffinity(), and then to the number of online processors with sysconf(_SC_NPROCESSORS_ONLN).
On macOS, libuv uses sysconf(_SC_NPROCESSORS_ONLN). On Windows, it uses GetActiveProcessorCount(ALL_PROCESSOR_GROUPS).
The cgroups v2 file is easy to understand. /sys/fs/cgroup/cpu.max contains two values -
200000 100000The first value is the quota. The second value is the period. In this case, the process gets 200,000 microseconds of CPU time per 100,000 microseconds of wall time. That works out to 2 CPUs. If the quota is max, there is no CPU quota, so libuv uses the next available method.
System-Level vs Process-Level Memory
os.totalmem() returns total system memory in bytes. os.freemem() returns memory that is available to the system.
const total = os.totalmem();
const free = os.freemem();

const usedPct = ((1 - free / total) * 100).toFixed(1);
console.log(`${usedPct}% memory used`);
These are machine-level numbers. They are different from process.memoryUsage().
Use os.totalmem() and os.freemem() when you want to know about the host. Use process.memoryUsage() when you want to know about the current Node process.
For example, process.memoryUsage().rss tells you how much resident memory this Node process is using. os.freemem() tells you how much memory the machine can currently make available.
The word "free" needs some care. Operating systems do not all count available memory the same way.
On Linux, os.freemem() reads MemAvailable from /proc/meminfo. That value estimates how much memory can be given to new applications without swapping. It includes memory that is currently used for page cache or reclaimable kernel caches, because that memory can be reused when applications need it.
That is why a healthy Linux server can show a tiny MemFree value and still have plenty of usable memory. Linux likes to use spare RAM as disk cache. Low raw free memory is not automatically a problem.
A machine might show 200 MB of MemFree and 8 GB of MemAvailable. If your health check alerts on raw free memory, it can mistake normal Linux cache behavior for an outage. Use the meaning of the number, not just the name.
macOS gets memory data from the Mach VM subsystem. It classifies memory into groups such as wired, active, inactive, and free. Wired memory is pinned for the kernel. Active memory was used recently. Inactive memory is cached but can be reused. Free memory is unused. libuv adds inactive and free pages together because inactive pages can be reclaimed.
Windows uses GlobalMemoryStatusEx. Its available physical memory value already accounts for reclaimable cache.
os.totalmem() is more predictable. It reports the physical memory visible to the operating system. A 16 GB machine usually reports close to 16 GB, although firmware and hardware reservations can remove some memory before the OS sees it.
Memory in Containers
The os module is more container-aware for CPU than it is for memory.
os.availableParallelism() respects CPU limits. os.totalmem() and os.freemem() may still report host memory inside a container.
That means a container limited to 512 MB can still see this -
os.totalmem(); // 64 GB host memoryThe process cannot actually use 64 GB. It only has the container limit. The os module simply does not expose that memory limit directly.
Node itself has some awareness of cgroup memory limits. That awareness is used by runtime behavior such as automatic heap sizing. For your own code, the official API is process.constrainedMemory(), available in Node 19.6 and newer. It returns the constrained memory limit when one exists, or undefined when the process is not constrained.
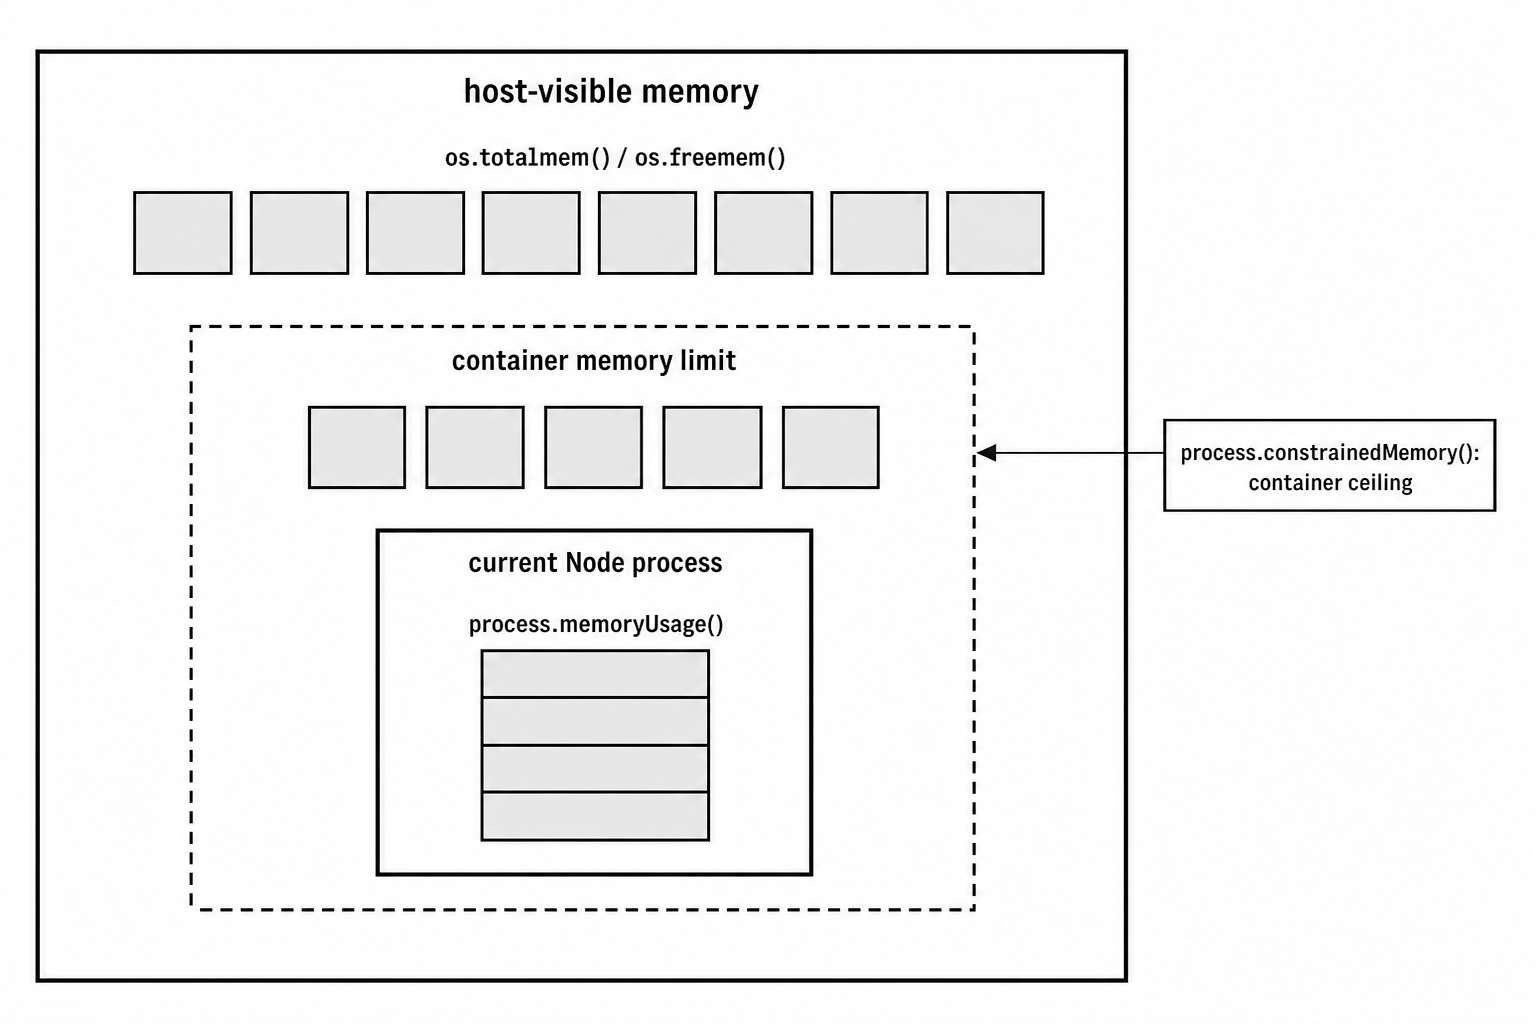
Figure 5.2 - Memory readings have different scopes. os.totalmem() and os.freemem() describe host-visible memory. Container limits can be much smaller. process.memoryUsage() reports the current Node process.
If you need to read the container memory limit yourself on Linux, you can read the cgroup files. This helper tries cgroups v2 first -
const fs = require('node:fs');

function getContainerMemLimit() {
  try {
    const raw = fs.readFileSync('/sys/fs/cgroup/memory.max', 'utf8').trim();
    return raw === 'max' ? os.totalmem() : parseInt(raw, 10);
  } catch {
    return os.totalmem();
  }
}
For cgroups v1, the file is usually /sys/fs/cgroup/memory/memory.limit_in_bytes.
For production monitoring inside containers, compare process memory against the constrained limit. A useful pairing is process.memoryUsage().rss and process.constrainedMemory().
Load Average
os.loadavg() returns three numbers -
os.loadavg(); // [1.34, 2.01, 1.87]Those are the 1-minute, 5-minute, and 15-minute load averages. On Windows, this function always returns [0, 0, 0] because Windows does not expose an equivalent kernel metric.
Load average measures demand on the system. On Unix-like systems, it counts tasks that are running on CPU and tasks that are ready to run but waiting in the run queue.
Linux adds one extra behavior. It also includes tasks in uninterruptible sleep, which usually means blocked disk I/O. Because of that, a Linux server can show high load average even when CPU usage is low. The pressure may be storage, not CPU.
Other Unix systems, including macOS and FreeBSD, do not count those I/O-waiting tasks in the same way. So load average is best compared over time on the same kind of machine, not used as a perfect cross-platform number.
To read load average well, compare it with available CPU count -
const load1m = os.loadavg()[0];
const cpuCount = os.availableParallelism();
const ratio = load1m / cpuCount;
On a 4-CPU machine, a load average of 4.0 means the system is fully occupied on average. A load average of 8.0 means there is more work than the CPUs can run immediately.
A ratio above 1.0 means work is waiting. Around 0.7 is often worth watching. Below 0.3 usually means the machine is idle or lightly loaded. These are rough guidelines. I/O-heavy workloads can show higher load without burning CPU the whole time.
The three windows tell you the story -
| Pattern | Meaning |
|---|---|
| 1-minute high, 15-minute low | A recent spike. |
| All three rising | Sustained pressure. |
| 1-minute falling, 15-minute still high | The spike is ending, but the longer average has not caught up yet. |
Linux updates load average every 5 seconds. Between updates, the value is stale. The 1-minute average uses exponential smoothing. In simple terms, every update blends the previous load value with the current number of runnable plus uninterruptible tasks.
The Linux formula looks like this -
load(t) = load(t-1) * exp(-5/60) + n * (1 - exp(-5/60))Here, n is the current number of runnable plus uninterruptible tasks. The 5-minute and 15-minute averages use the same idea with different time windows.
macOS also uses smoothing, but it gets run queue data through the Mach scheduler. Since macOS and Linux count slightly different task states, use load average as a trend signal, not as a perfect universal measurement.
Network Interfaces
os.networkInterfaces() returns the network addresses currently assigned to the machine.
The result is an object keyed by interface name. Each interface maps to an array because a single interface can have multiple addresses.
const interfaces = os.networkInterfaces();

console.log(Object.keys(interfaces));
// ['lo0', 'en0', 'en1', 'utun0', 'awdl0', 'bridge0']
The interface names come from the operating system.
On macOS, en0 is often the main Wi-Fi or Ethernet interface. utun interfaces usually come from VPNs. On Linux, you may see names like eth0, ens3, wlp2s0, or enp0s25, depending on the naming scheme. lo or lo0 is loopback. Docker hosts often have docker0, and container networking can create veth interfaces.
An address entry looks like this -
{
  address: '192.168.1.42',
  netmask: '255.255.255.0',
  family: 'IPv4',
  mac: 'a4:83:e7:2b:1f:c0',
  internal: false,
  cidr: '192.168.1.42/24'
}
Here is what those fields mean -
| Field | Meaning |
|---|---|
address | The IP address assigned to the interface. |
netmask | The subnet mask for that address. |
family | Either 'IPv4' or 'IPv6'. |
mac | The MAC address, when the platform provides one. |
internal | true for loopback addresses such as 127.0.0.1 and ::1. |
cidr | The address with its subnet prefix length. |
scopeid | Present on some IPv6 addresses to identify the interface scope. |
A common helper is "give me a non-loopback IPv4 address" -
function getExternalIPv4() {
  const nets = os.networkInterfaces();

  for (const name of Object.keys(nets)) {
    for (const net of nets[name]) {
      if (net.family === 'IPv4' && !net.internal) {
        return net.address;
      }
    }
  }
}
That works on simple machines. On a laptop with one Wi-Fi connection, it probably returns the address you expect.
On production machines, be more careful. A server may have multiple NICs, Docker bridges, VPN tunnels, bonded interfaces, and service-mesh networking. The first non-internal IPv4 address may not be the address your service should advertise. Production code usually filters by interface name, CIDR range, or environment configuration.
The result is also a snapshot. If DHCP changes your address after you call os.networkInterfaces(), your cached value is stale. A disconnected Ethernet port with no assigned address may not appear. An interface that is administratively down may not appear either.
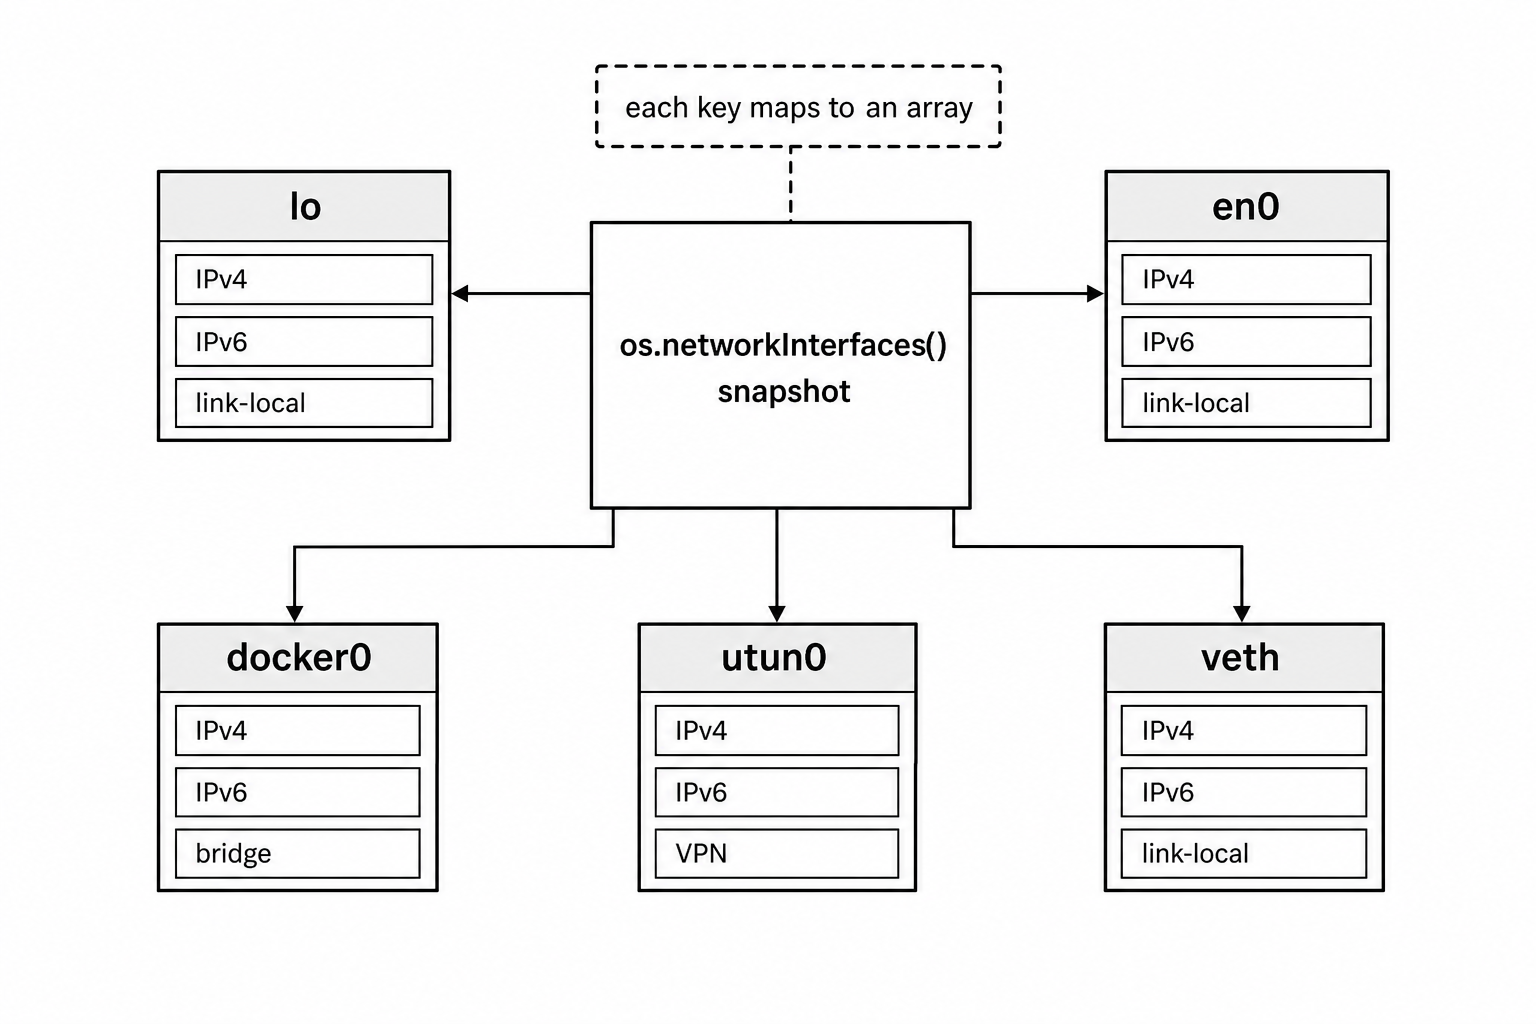
Figure 5.3 - os.networkInterfaces() returns a snapshot keyed by interface name. Each interface maps to an array because one interface can expose several IPv4, IPv6, VPN, bridge, or container-related addresses at the same time.
The mac field also needs care. Loopback interfaces usually report '00:00:00:00:00:00'. Some virtual interfaces, VPN tunnels, and tun/tap devices also report all zeros. Containers and virtual machines usually get virtual MAC addresses from the runtime or hypervisor. Docker can generate MAC addresses based on container IDs. That makes MAC addresses a weak choice for licensing or hardware fingerprinting.
IPv6 addresses are common even when you did not manually configure IPv6. Modern operating systems often create link-local IPv6 addresses with the fe80:: prefix on active interfaces. These addresses belong to a specific interface, so they may include a scopeid.
Platform and Architecture
The os module has several functions that identify the system. They overlap, but they come from different layers.
os.platform() returns the same value as process.platform. You will see values such as 'linux', 'darwin', 'win32', 'freebsd', 'openbsd', 'sunos', or 'aix'. This is the platform Node was built for.
os.type() returns the operating system name from the system. Linux returns 'Linux', macOS returns 'Darwin', and Windows returns 'Windows_NT'. It usually agrees with os.platform(), but it uses system names instead of Node's normalized identifiers.
os.arch() returns the architecture Node was built to target. Common values include 'x64', 'arm64', 'ia32', 'arm', 's390x', 'ppc64', 'mips', and 'riscv64'. This is the same value as process.arch.
os.machine() was added in Node 18.9. It returns the raw machine hardware name from the kernel. It does not normalize the value the way os.arch() does.
Here is a simple comparison -
console.log(os.platform()); // 'darwin'
console.log(os.type());     // 'Darwin'
console.log(os.arch());     // 'arm64'
console.log(os.machine());  // 'arm64'
On x86_64 Linux, os.arch() returns 'x64', while os.machine() returns 'x86_64'.
os.release() returns the kernel version string. On Linux, it might look like '5.15.0-76-generic'. On macOS, it returns the Darwin kernel version, such as '23.1.0', not the marketing version like "Sonoma 14.1". On Windows, it returns a version string such as '10.0.22621'.
os.version() returns a fuller OS version string. On macOS, it can include the Darwin kernel build line. On Linux, it includes kernel build text, but not the Linux distribution name. Distribution information usually lives in files such as /etc/os-release. On Windows, os.version() returns a more user-facing name such as 'Windows 10 Pro' or 'Windows 11 Home'.
That Windows distinction is worth knowing. os.release() can return values like '10.0.22621' for Windows 11 because Microsoft kept the internal major version at 10.0. Windows 11 is identified by build numbers 22000 and above. If you need a user-facing Windows name, os.version() is usually more helpful than os.release().
These values show up in platform-specific code, startup logs, native binary loading, CLI behavior, and diagnostics. A common pattern is building a platform-specific binary path -
const binPath = `./vendor/${os.platform()}-${os.arch()}/tool`;Tools such as esbuild and swc use this kind of platform and architecture split to ship prebuilt binaries, such as esbuild-darwin-arm64 or esbuild-linux-x64.
System Paths and Identity
os.hostname() returns the current system hostname -
os.hostname(); // 'macbook-pro.local'On many Unix systems, it matches the hostname command. On cloud machines, it may be an instance-style name such as ip-10-0-1-43.ec2.internal. In Kubernetes, it often defaults to the pod name.
The hostname can change while the process is running, although that is uncommon. os.hostname() asks the system each time you call it.
os.homedir() returns the current user's home directory. On Unix, Node checks the HOME environment variable first, then falls back to the password database entry. On Windows, it checks USERPROFILE first, then falls back to HOMEDRIVE plus HOMEPATH.
os.tmpdir() returns the default temporary directory. On Unix, it checks TMPDIR, TMP, and TEMP, then falls back to /tmp. On Windows, it checks TEMP and TMP, then falls back to the Windows temp directory.
Here are the basic calls -
os.homedir(); // '/Users/ishtmeet'
os.tmpdir();  // '/tmp'
Both functions respect runtime configuration. If a CI system starts your process with TMPDIR=/scratch, then os.tmpdir() returns /scratch. That is why portable code should not hardcode /tmp.
macOS is a good example. Even though /tmp exists, os.tmpdir() often returns a per-user path under /var/folders/.../T/, because macOS sets TMPDIR for each user session.
User Information
os.userInfo() returns information about the user running the process -
const info = os.userInfo();On Unix, it returns values like this -
{
  uid: 501,
  gid: 20,
  username: 'ishtmeet',
  homedir: '/Users/ishtmeet',
  shell: '/bin/zsh'
}
The fields are straightforward. uid and gid are the Unix user and group IDs. username is the login name. homedir is the home directory from the system user database. shell is the configured login shell.
There is one detail that trips people up. os.userInfo().homedir and os.homedir() can come from different places.
os.userInfo().homedir comes from the system user database or directory service. os.homedir() checks environment variables first. If a user runs this -
HOME=/custom node app.jsthen os.homedir() returns /custom, while os.userInfo().homedir still returns the home directory configured for that user.
For application code, os.homedir() is usually the better choice because it respects the environment the process was launched with.
On Windows, uid and gid are both -1 because Windows uses SIDs instead of Unix-style numeric IDs. username comes from the Win32 API, and shell is null.
The encoding option controls how string fields are returned. The default is 'utf8'. Passing { encoding: 'buffer' } returns Buffer instances instead of strings -
const info = os.userInfo({ encoding: 'buffer' });That is rare in modern application code, but it can help when a username or path contains bytes that are not valid UTF-8.
Line Endings and Endianness
os.EOL gives the platform's line ending. On Unix, it is '\n'. On Windows, it is '\r\n'.
const lines = ['first line', 'second line', 'third line'];
const output = lines.join(os.EOL);
Use os.EOL when you want output to follow the current platform's convention, such as console output or local log files.
For files that move between platforms, an explicit '\n' is often better. JSON, YAML, config files, and source files usually work fine with '\n' everywhere. Git can also handle checkout conversion through settings such as core.autocrlf.
os.endianness() returns 'LE' or 'BE'.
os.endianness(); // 'LE'Most machines running Node today are little-endian. That includes x86, x64, and ARM in the common modes. Big-endian systems still exist in some IBM POWER setups, some MIPS variants, and embedded environments, but they are uncommon for server-side JavaScript.
Host endianness can matter when working with raw binary data. In most application code, though, the protocol or file format defines byte order. That is why Buffer methods such as readInt32BE() and readInt32LE() are usually the better choice. They make the byte order explicit instead of relying on the host.
System Uptime
os.uptime() returns how long the host has been running, in seconds -
os.uptime(); // 847293This is system uptime, not Node process uptime. A server that booted 10 days ago reports around 864,000 seconds, even if your Node process started 5 minutes ago.
Use process.uptime() when you want the current Node process lifetime.
On Linux, libuv reads /proc/uptime. The first number in that file is seconds since boot. On macOS, libuv uses sysctl with KERN_BOOTTIME and compares that boot time with the current time. On Windows, GetTickCount64() returns milliseconds since boot.
System uptime is useful for spotting recent host restarts. If a health check sees os.uptime() under 300 seconds, the machine probably rebooted recently.
Inside containers, be careful. os.uptime() usually reports the host's uptime, not the container's uptime. If the Node process starts with the container, process.uptime() is usually a better signal for container lifetime. For lower-level container checks, you can inspect the start time of process 1 through /proc/1/stat.
Constants
os.constants contains groups of operating-system constants. The two most common groups are signals and errno.
Signal constants look like this -
os.constants.signals.SIGTERM; // 15
os.constants.signals.SIGKILL; // 9
os.constants.signals.SIGINT;  // 2
The signals object contains signal names supported by the platform. Linux exposes many POSIX signals plus real-time signals. macOS exposes the standard Unix signals. Windows only has meaningful support for a small set such as SIGINT, SIGTERM, SIGKILL, and SIGBREAK.
Other signal constants may exist on Windows, but the operating system does not deliver them the same way Unix systems do.
Errno constants look like this -
os.constants.errno.ENOENT;     // -2
os.constants.errno.EACCES;     // -13
os.constants.errno.EADDRINUSE; // -98 on Linux, -48 on macOS
Errno numbers are platform-dependent. EADDRINUSE is -98 on Linux and -48 on macOS. These values come through libuv's normalization, where libuv negates POSIX errno values and maps platform errors into a common set.
In normal application code, check err.code strings such as 'EADDRINUSE' instead of hardcoding numbers. The numeric constants are more useful when working close to libuv, native addons, or low-level diagnostics.
Priority constants connect to process scheduling priority -
os.constants.priority.PRIORITY_LOW;          // 19
os.constants.priority.PRIORITY_BELOW_NORMAL; // 10
os.constants.priority.PRIORITY_NORMAL;       // 0
os.constants.priority.PRIORITY_HIGH;         // -14
You use these with os.getPriority() and os.setPriority().
Process Priority
os.getPriority() reads scheduling priority. os.setPriority() changes it.
os.getPriority();     // 0
os.getPriority(1234); // priority of process 1234
With no argument, or with 0, os.getPriority() checks the current process. With a PID, it checks another process.
The return value follows Unix nice values. 0 is normal. Positive values lower priority, up to 19. Negative values raise priority, down to -20. A lower nice value means the scheduler gives the process more preference.
You can lower the current process priority like this -
os.setPriority(os.constants.priority.PRIORITY_LOW);PRIORITY_LOW maps to 19, which tells the scheduler to prefer other processes over yours. That can be useful for background workers, maintenance jobs, and batch scripts where latency is not sensitive.
Raising priority is different. Setting something like PRIORITY_HIGH usually requires root or administrator permissions.
On Linux, these calls map to getpriority() and setpriority(). An unprivileged user can raise the nice value, which lowers their own priority. Lowering the nice value, which raises priority, requires root or CAP_SYS_NICE.
On Windows, the constants map to Windows priority classes such as IDLE_PRIORITY_CLASS, BELOW_NORMAL_PRIORITY_CLASS, NORMAL_PRIORITY_CLASS, ABOVE_NORMAL_PRIORITY_CLASS, and HIGH_PRIORITY_CLASS.
Always handle errors when changing priority. If the process lacks permission, os.setPriority(pid, priority) throws a system error with codes such as EACCES or EPERM.
This API has a narrow but real use case. If a background job processor runs on the same machine as a latency-sensitive HTTP server, the worker can use PRIORITY_BELOW_NORMAL so it yields CPU time sooner. In containerized deployments with one workload per container, this is less common because CPU limits usually handle isolation. On shared VMs or bare metal, priority can still help.
How CPU and Memory Calls Reach the System
The os module looks simple from JavaScript, but each call goes through platform-specific system interfaces.
When you call os.cpus(), Node's C++ binding calls libuv's uv_cpu_info(). libuv allocates an array of CPU info structs and fills them differently depending on the operating system.
Linux
On Linux, libuv reads /proc/stat and parses the per-CPU lines. A line looks like this -
cpu0 10132153 290696 3084719 46828483 16683 0 25195 0 0 0The fields are, in order, user, nice, system, idle, iowait, irq, softirq, steal, guest, and guest_nice.
Linux stores these values in clock ticks, often called jiffies. The length of a jiffy depends on the kernel configuration. Many kernels use 100 ticks per second, where one tick is 10 ms. Others use 250 or 1000 ticks per second. libuv converts the values to milliseconds using sysconf(_SC_CLK_TCK).
The CPU model comes from /proc/cpuinfo, usually from the model name field. The speed comes from the cpu MHz field.
Linux has a few extra CPU fields that do not map one-to-one into the JavaScript object. iowait measures time when the CPU was idle while I/O was outstanding. libuv folds that into idle. steal measures time a hypervisor assigned this virtual CPU to another VM, which can show up in cloud environments. guest and guest_nice count time spent running guest VMs.
On 32-bit systems, CPU time counters can wrap after long uptimes. At CONFIG_HZ=100, a 32-bit counter overflows after roughly 497 days. After wraparound, delta calculations can briefly produce impossible CPU usage values. On 64-bit systems, this is not a practical concern. It only tends to matter on 32-bit embedded devices or long-running IoT gateways.
macOS
On macOS, libuv uses Mach's host_processor_info() call with PROCESSOR_CPU_LOAD_INFO. The result contains one CPU timing struct per logical CPU.
Each struct has timing fields for user, system, idle, and nice states. macOS folds interrupt time into system time. libuv converts the tick values to milliseconds.
For model and speed, libuv reads sysctl values. machdep.cpu.brand_string gives the CPU brand string. hw.cpufrequency gives the clock speed in Hz.
On Apple Silicon, hw.cpufrequency reports the performance-core frequency. Efficiency cores run at a different frequency, but os.cpus() does not report separate speeds for P-cores and E-cores.
Windows
On Windows, libuv calls GetSystemInfo() for processor count. It then calls NtQuerySystemInformation() with SystemProcessorPerformanceInformation for per-CPU timing data.
Windows returns time values as 100-nanosecond FILETIME intervals. CPU model information comes from the Registry path HKLM\HARDWARE\DESCRIPTION\System\CentralProcessor\0\ProcessorNameString. Speed comes from the ~MHz DWORD value in the same Registry area.
Memory follows the same pattern. JavaScript calls a small os function. Node calls libuv. libuv asks the host.
Linux memory
On Linux, os.freemem() calls libuv's uv_get_free_memory(). libuv reads /proc/meminfo and uses MemAvailable when it exists.
Older Linux kernels before 3.14 do not expose MemAvailable, so libuv falls back to MemFree. That fallback is less helpful because MemFree only counts pages that are completely unused. MemAvailable estimates memory that can be made available without swapping, after considering page cache, reclaimable slab caches, and kernel watermarks.
os.totalmem() reads MemTotal from the same file.
macOS memory
On macOS, free memory comes from host_statistics64() with HOST_VM_INFO64. libuv adds free_count and inactive_count, then multiplies by the VM page size. Apple Silicon commonly uses 16384-byte pages. Intel Macs commonly use 4096-byte pages.
macOS includes inactive pages because they can be reclaimed. A busy Mac can show low raw free memory while still having enough inactive memory to satisfy new allocations.
Total memory comes from sysctl with HW_MEMSIZE.
Windows memory
On Windows, libuv uses GlobalMemoryStatusEx(). The ullAvailPhys field gives available physical memory. The ullTotalPhys field gives total physical memory. Windows also uses memory for caching, and its available-memory number already accounts for reclaimable cache.
Node also exposes container memory constraints through process.constrainedMemory(), backed by libuv's uv_get_constrained_memory(). In containers, that reads cgroup memory limits from files such as memory.max for cgroups v2 or memory.limit_in_bytes for cgroups v1.
The os module does not expose that constrained-memory call directly. Use process.constrainedMemory() or read the cgroup files yourself when container memory limits are part of your monitoring.
Practical Patterns
A small monitoring endpoint often starts with a system health object like this -
function systemHealth() {
  const cpuCount = os.availableParallelism();
  const load1m = os.loadavg()[0];
  const freeGb = os.freemem() / 1073741824;
  const totalGb = os.totalmem() / 1073741824;

  return {
    cpuCount,
    loadPerCpu: load1m / cpuCount,
    freeGb,
    totalGb
  };
}
That gives you enough to answer quick operational questions. How many CPUs should this process assume it has? Is load high relative to that CPU count? How much memory is available on the host?
For platform checks, compute the result once and reuse it -
const isWindows = os.platform() === 'win32';
const isMac = os.platform() === 'darwin';
const isLinux = os.platform() === 'linux';
os.platform() is effectively constant for the life of the process. Caching these booleans also makes hot code easier to read.
For service registration or discovery, network interfaces can help a process decide which address to report -
function getServiceAddress() {
  for (const [name, addrs] of Object.entries(os.networkInterfaces())) {
    const v4 = addrs.find((addr) => addr.family === 'IPv4' && !addr.internal);

    if (v4) {
      return {
        interface: name,
        address: v4.address,
        cidr: v4.cidr
      };
    }
  }

  return null;
}
In Kubernetes, the pod IP is often the address your service binds to or reports. Service mesh sidecars such as Envoy and Linkerd also need to know the pod IP for routing. os.networkInterfaces() lets the process discover assigned addresses at runtime instead of hardcoding them.
For production systems, still prefer an explicit configured address when you have one. Auto-detection is helpful, but machines with VPNs, bridges, multiple NICs, and containers can have several valid-looking addresses.
Startup Logging
Logging a small system summary at startup can save a lot of time later.
console.log({
  hostname: os.hostname(),
  platform: `${os.platform()}-${os.arch()}`,
  cpus: os.availableParallelism(),
  totalMemMb: Math.round(os.totalmem() / 1048576),
  nodeVersion: process.version,
  uptime: Math.round(os.uptime() / 3600) + 'h'
});
When you read production logs later, this context helps. A service running in a 2-CPU, 512 MB container behaves very differently from the same service on a 64-CPU, 256 GB machine. A few startup fields can explain performance behavior that would otherwise look confusing.
What the os Module Doesn't Cover
The os module focuses on machine-level information that libuv exposes. It does not try to cover every piece of system administration.
Process-level memory belongs to process.memoryUsage(). Process uptime is process.uptime(). Environment variables live on process.env.
Disk capacity is not part of the os module. Node does not provide os.diskfree() or os.disks(). For filesystem capacity, use fs.statfs(), added in Node 18.15. It returns information about the filesystem containing a specific path. You still need to choose the path you care about.
GPU information is outside the module too. Node has no built-in GPU API. VRAM usage, GPU temperature, and GPU utilization usually come from native addons, platform-specific APIs, or child process calls to tools such as nvidia-smi.
Battery information is also missing. There is no os.battery(). On Linux, battery data is under /sys/class/power_supply/. On macOS, IOKit exposes it. On Windows, GetSystemPowerStatus() exposes it. libuv does not wrap those APIs, so Node does not expose them through os.
Temperature sensors, fan speeds, and hardware monitoring data are out of scope as well. The module focuses on values commonly needed by I/O-driven server programs, such as CPU, memory, networking, paths, user identity, and platform identity.
Process listing is another gap. There is no built-in os.processes(). On Linux, you would scan numeric directories under /proc/. On macOS, sysctl with KERN_PROC can read the process table. On Windows, CreateToolhelp32Snapshot() can enumerate processes. Packages such as ps-list wrap those platform-specific approaches.
Almost all of node:os is read-only. The main exception is os.setPriority(), which can change scheduling priority. You cannot use this module to change the hostname, add network interfaces, modify memory limits, or tune kernel settings. Those operations need privileged system tools, platform APIs, or native addons.