Node.js Event Loop Explained: Phases, Microtasks, nextTick, and setImmediate
The event loop is two layers working together. libuv gives you the native loop engine, and Node adds its own JavaScript scheduling rules on top. The work itself is split across separate queues. Timers, I/O callbacks, check steps, close handlers, promise reactions, and process.nextTick() callbacks each wait in their own queue, and Node drains those queues at fixed checkpoints.
The rule that governs all of it is simple. While JavaScript is running on the call stack, every queued callback waits. The moment the stack empties, Node drains its high-priority internal queues, then lets libuv advance through its phases. Timer callbacks run when their timers expire. Most network and file-completion callbacks arrive through the polling path. setImmediate() callbacks run in the check phase, and close handlers run later still.
The final order depends on how four things interact, the call stack, process.nextTick(), V8 promise jobs, and whichever libuv phase is active. That interaction is why setTimeout(..., 0) and setImmediate() swap places depending on where you call them, yet run in a fixed order in other cases.
We look closer at how promises schedule in Promise microtasks. For process startup, active resource tracking, and shutdown, see Node.js process lifecycle.
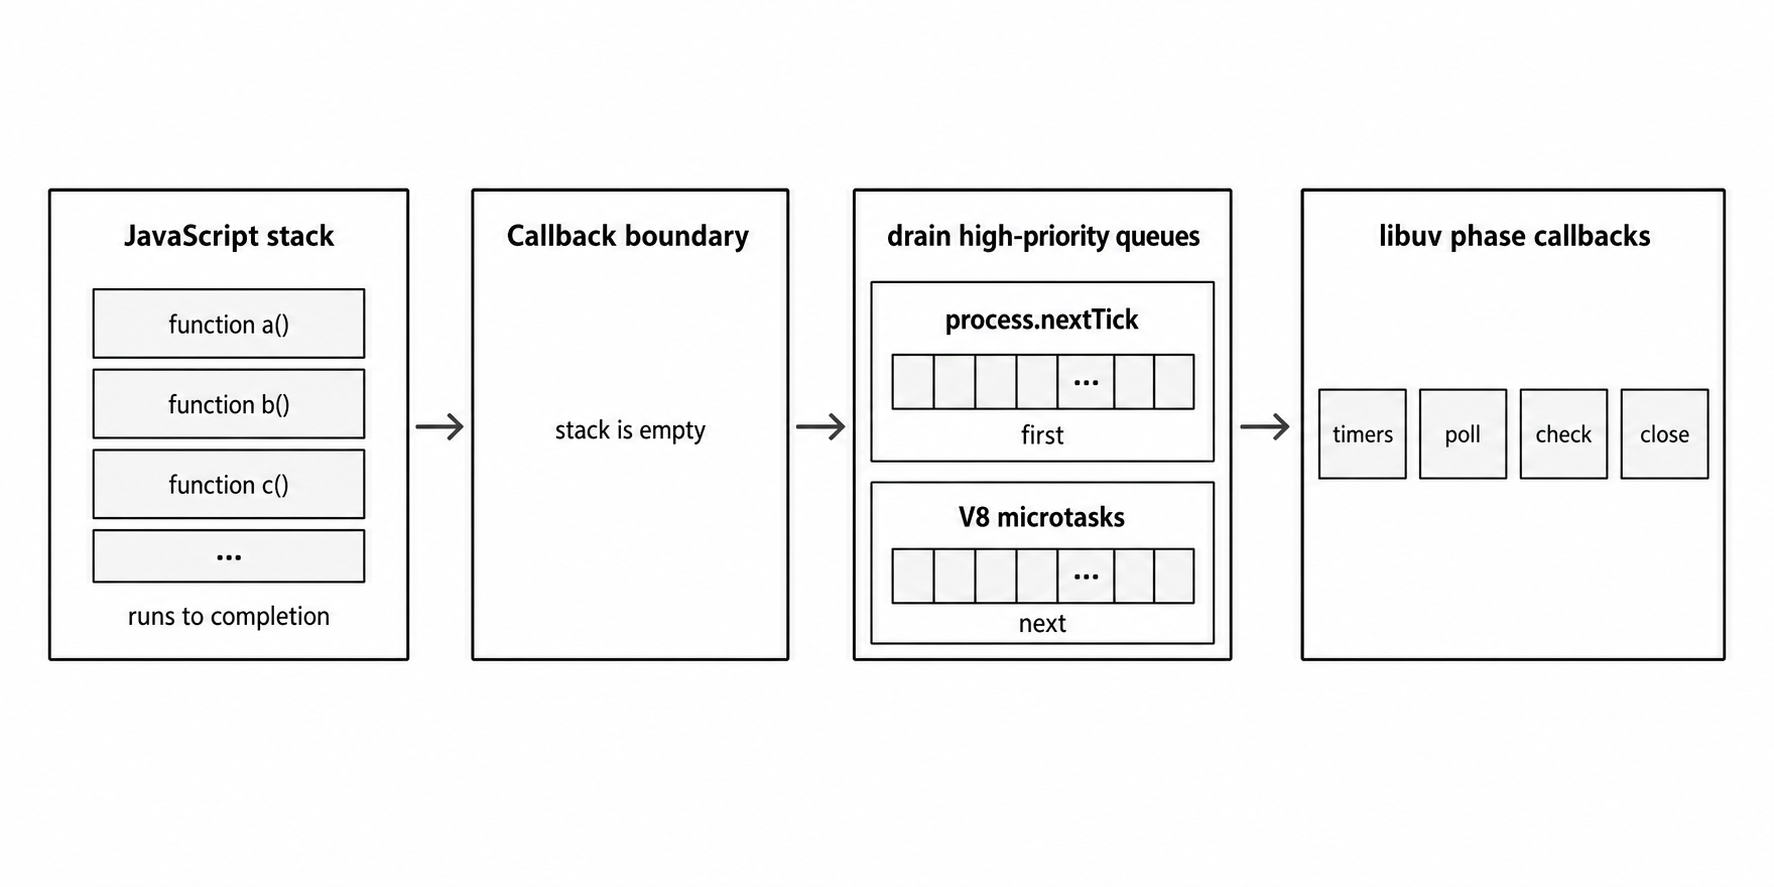
Figure 1 - Node runs JavaScript to a callback return point, drains process.nextTick() callbacks and V8 microtasks, and then continues through libuv phase work.
What the Event Loop Does
The event loop moves your program back and forth between two things, running JavaScript and waiting for native system events. It starts right after your main script finishes and the call stack clears. From then on, the process stays alive as long as it has active resources, like open sockets, running servers, or pending timers.
The Call Stack
A JavaScript function frame stays on the call stack until the function returns or throws. While code is running, no queued callback can break in and run on that thread. A callback can be completely ready and it still waits, because the main thread is busy with the current stack.
The stack is last-in, first-out. When one function calls another, the new frame goes on top of the caller. When that inner function returns, its frame pops off and control drops back to the frame underneath.
function third() {
  console.log("Three");
}
function second() {
  console.log("Two");
  third();
  console.log("Done with second");
}
second();
This outputs:
Two
Three
Done with second
Here second() stays on the stack the whole time third() runs. Only after third() returns does second() reach its final log. On the main thread, execution always belongs to whatever frame sits at the top of the stack.
What "Blocking" Truly Means
When people say a function is "blocking the event loop," they mean it sits on the main call stack long enough to hold up everything else. While that function runs, no timer, network callback, promise reaction, or setImmediate() task can break in.
You can see the delay with a heavy synchronous operation on the CPU.
const crypto = require("node:crypto");
const start = Date.now();

setTimeout(() => console.log("Timer was delayed."), 100);

while (Date.now() - start < 500) {
  crypto.pbkdf2Sync("password", "salt", 1000, 64, "sha512");
}

console.log("Blocking work finished.");
Run this and the timer only logs after the heavy loop finishes. A timer delay is a minimum wait, not a promise to interrupt running code the millisecond it expires.
The execution breaks into five steps.
setTimeout()registers a timer with Node that becomes eligible to run after roughly 100ms.- The
whileloop holds the call stack for 500ms, running synchronous crypto the whole time. - The 100ms threshold passes while the loop is still running, but Node cannot pause it to run the callback.
- The call stack empties once the 500ms loop finishes.
- Node reaches its timer phase on its next pass through the loop and finally runs the delayed callback.
A single slow function stalls every other task in the application. Node keeps I/O from blocking the main stack, but it cannot stop CPU-heavy JavaScript from freezing the thread.
V8, Libuv, and Bindings
The Node runtime is built from four parts, V8, Node's internal C++ bindings, libuv, and the standard JavaScript library. The event loop sits where these layers meet, so its execution order comes down to how they hand work off to each other.
The V8 Execution Engine
This section covers the parts of V8 that affect how the event loop orders execution. We covered these in the previous chapter.
V8 is Google's open-source JavaScript engine, and it runs your code. Inside Node, V8 parses and compiles your script, manages active functions on the call stack, allocates memory on the heap, and runs garbage collection.
V8 on its own cannot talk to the file system or the network. Functions like setTimeout(), fs.readFile(), and http.createServer() are host APIs that Node provides, not V8. So the runtime constantly translates JavaScript values inside V8 into native C++ that the rest of the system can use.
Libuv
libuv handles non-blocking network I/O, timers, child processes, asynchronous file-system operations, and the worker pool used for certain blocking tasks.
The core loop mechanics belong to libuv, handles, requests, polling integration, timers, and phase progression. Node drives JavaScript callback execution on top of it, draining its own priority queues each time the runtime crosses from native code back into JavaScript.
libuv also hides the differences between operating systems. Linux uses epoll, macOS uses kqueue, and Windows uses I/O Completion Ports (IOCP). libuv wraps all three behind one native abstraction, which is how Node exposes a single portable JavaScript API.
The libuv worker pool is the other piece to know. JavaScript runs on one main thread, but libuv keeps a global pool of background threads for tasks where the operating system has no practical non-blocking interface. Node uses it for file-system operations, dns.lookup(), and heavy crypto or compression. The pool defaults to four threads, and you can raise it at startup with the UV_THREADPOOL_SIZE environment variable, up to 1024.
Since libuv 1.45.0, which shipped in Node.js 20, timers run only after the poll phase finishes, instead of being checked both before and after. That shifts the behavior of some edge cases that mix timers with setImmediate(), and it is one more reason to treat timer delays as loose thresholds, not exact guarantees.
C++ Bindings
V8 works with JavaScript values and functions. libuv works with native handles, requests, file descriptors, and low-level platform APIs. Node's C++ bindings connect these two environments.
When you call fs.readFile("/path/to/file", callback), the work runs through seven steps.
- Your JavaScript code calls the high-level
fs.readFile()function to start the request. - Node routes this call through its internal JavaScript wrapper and down into its C++ implementation layer.
- The native layer packages the file path, operational flags, and callback reference into a native request object.
- libuv takes that request and submits it to the worker pool for background execution.
- The background thread reads the file from disk and reports completion back to the main event loop the moment it finishes.
- Node translates the raw, native data buffer back into standard JavaScript values that V8 can understand.
- Node invokes your original JavaScript callback at the very next available callback return point.
That round trip, from JavaScript to C++ to libuv to the operating system and back, is how most asynchronous APIs in Node work. Network I/O usually talks straight to the operating system's native readiness queues, while file-system work leans on the libuv worker pool to keep the main thread free.
Event Loop Phases
Many people picture the event loop as one big queue where callbacks line up. It is not. It is an ordered sequence of phases, and each phase has its own queue and its own rules. The phases go by their traditional names, timers, pending callbacks, idle/prepare, poll, check, and close callbacks.
The word "tick" gets confused with process.nextTick(), which runs on the JavaScript side rather than the native side, so this chapter uses iteration for one complete pass through the loop.
Overview of a Single Iteration
An iteration is not a fixed unit of time. One pass can be very fast or very slow, depending on how many callbacks are waiting and how long the loop pauses for network or disk I/O.
When the loop enters a phase, it does that phase's low-level native work first. Then it runs the callbacks waiting in that phase's queue, usually first-in, first-out. It keeps going until the queue is empty or it hits a built-in safety limit, then it moves to the next phase.
The Timers Phase
setTimeout() and setInterval() callbacks run in the timers phase. The traditional event-loop diagrams still help you sort the callback categories, but one detail has changed. Starting with Node.js 20 and libuv 1.45.0, timers run strictly after the poll phase finishes. Older docs and older Node versions show timers running both before and after the poll phase. That is no longer true.
A timer callback never runs at the exact millisecond you ask for. The delay you pass is a minimum threshold, the earliest the callback can run. When Node reaches timer processing, it checks which thresholds have passed and runs the ones that are ready.
libuv stores active timers in a min-heap, a tree that keeps the next timer to expire at the root. That layout lets the loop work out quickly how long it can wait on other tasks before the next timer is due.
The min-heap is an internal libuv detail, not a guarantee in any JavaScript API. The practical point is that finding the next timer is cheap, while scheduling or canceling a large number of timers at once still has a small cost.
Pending Callbacks and Internal Operations
The loop also passes through a few internal phases you rarely touch directly. The first is pending callbacks. It runs certain I/O callbacks that were deferred from the previous iteration. A TCP ECONNREFUSED connection error on some Unix systems is one example.
After that come the idle and prepare phases. libuv uses them for internal bookkeeping right before polling, and they are not exposed as public JavaScript scheduling APIs.
The Poll Phase
Polling means asking the operating system which I/O handles, like sockets or file descriptors, are ready for work.
The poll phase does the most work. It collects new I/O events and runs most of your I/O callbacks. It does two things.
First, it works out how long it can block while waiting for I/O. It checks for pending setImmediate() callbacks, active handles, and upcoming timer thresholds, then calls the platform's native poll provider, like epoll_wait on Linux. That blocking happens inside the operating system, not in a JavaScript busy loop that wastes your CPU.
Second, once the wait ends, because I/O data arrived, a timer threshold expired, or the engine hit a safety limit, Node runs the relevant callbacks. This is where many of your socket callbacks and worker-pool file-system completions run.
If the poll queue has items, the loop runs them until the queue drains or a safety limit stops it. Once the queue is empty, two rules decide what happens next.
- If any
setImmediate()callbacks are scheduled, the loop ends the poll phase and goes straight to the check phase. - If none are waiting, the loop pauses for new I/O, but it will not wait past the next due timer threshold or past libuv's internal limits.
One last point. Shutting the process down is not the job of some callback at the end of the poll phase. The moment no referenced handles, active requests, timers, immediates, or workers remain, Node sees it has no event-loop work left and exits cleanly.
The Check Phase
setImmediate() callbacks run in the check phase, and nothing else does. If you call setImmediate() inside an I/O callback, it runs as soon as that poll callback returns and Node has drained any high-priority queues the callback created.
Deferring Follow-up Work After I/O
setImmediate() is an in-process scheduling tool, not a durable background job system. For work that must survive a crash or retry automatically, use a persistent queue, a database-backed job table, or an external worker.
Use setImmediate() when you want an I/O callback to finish its main work before some follow-up code runs later in the check phase.
const fs = require("node:fs");

fs.readFile(__filename, (error) => {
  if (error) throw error;
  console.log("I/O callback: primary work finished");
  setImmediate(() => console.log("check phase: follow-up work"));
  console.log("I/O callback: response can be sent now");
});
The follow-up work is not guaranteed to run immediately in wall-clock time, since other queued tasks may be ahead of it. What you get is an ordering guarantee. Scheduled from inside an I/O callback, a setImmediate() always runs in the check phase before a zero-delay timer (setTimeout(..., 0)) scheduled from that same callback.
Use it to yield control during I/O-adjacent work in the same process. Do not use it for heavy or durable background queues.
Close Callbacks
This phase handles certain "close" events. If you tear down a connection with socket.destroy(), that socket's "close" event fires here. But not every close notification waits for this phase. Some go through other paths, like process.nextTick().
When this phase ends, the loop checks whether anything still keeps the process running. If active resources remain, like referenced handles, pending requests, open sockets, or running servers, Node starts the next iteration.
Microtasks, Phase Callbacks, and nextTick
The libuv phases tell you where timers, I/O, immediates, and close callbacks come from. They do not tell you the whole order. Node also keeps high-priority queues that it drains every time a JavaScript callback finishes.
Phase Callbacks and Microtasks
Browser documentation calls things like timers and I/O "macrotasks." In Node it is clearer to call them phase callbacks, the callbacks tied directly to libuv's phases, timers, pending callbacks, poll, check, and close events.
Two higher-priority queues sit on top of these phase callbacks. This is the part to get right.
- The next tick queue is managed entirely by Node, and it is where callbacks end up whenever you call
process.nextTick(). - The V8 microtask queue is managed by V8 itself, housing promise reactions and anything you schedule with
queueMicrotask().
The moment Node reaches a JavaScript callback return point, it drains the next tick queue first, then the V8 microtask queue, before moving to the next event-loop phase. That is why a promise reaction scheduled inside a timer callback runs before the next timer callback in that same phase.
Let's look at these two queues in more detail.
The Highest Priority process.nextTick() Queue
The name is misleading. process.nextTick() does not wait for the next event-loop iteration. It fires as soon as the current operation on the call stack finishes, right before Node takes its next step through the loop.
The Node.js docs mark process.nextTick() as Legacy. For deferring a task, default to queueMicrotask(). You only need nextTick now for older callback API contracts or when you want to pass extra arguments to the deferred function.
Node empties the next tick queue completely before it moves on, so recursive process.nextTick() calls lock up the app and starve your timers and I/O. That starvation risk is the reason not to reach for it by default. Here is a bounded example that shows the behavior.
let count = 0;
const LIMIT = 5;

function repeatWithNextTick() {
  console.log(`nextTick callback: ${++count}`);
  if (count < LIMIT) process.nextTick(repeatWithNextTick);
}

setTimeout(() => console.log("Timer ran after nextTick emptied."), 0);
repeatWithNextTick();
The output order is:
nextTick callback: 1
nextTick callback: 2
nextTick callback: 3
nextTick callback: 4
nextTick callback: 5
Timer ran after nextTick emptied.
The first repeatWithNextTick() call runs synchronously and leaves a second call queued in process.nextTick(). When the main script finishes, Node drains the next tick queue before it touches the timer. Each next-tick callback schedules the next one until count reaches LIMIT. Only then does Node run the timer callback. Remove the limit and let each callback schedule another nextTick forever, and Node stays stuck draining that queue while the timer never runs.
The Promise Jobs Queue
Promises run on V8's microtask queue. When a promise resolves or rejects, the callbacks you attached with .then(), .catch(), or .finally() get queued there. async/await uses the same queue to resume after an awaited promise settles.
In CommonJS top-level code or a regular event-loop callback, the order is fixed.
- Run the current JavaScript code or phase callback until it completely finishes.
- Drain the entire
nextTickqueue before doing anything else. - Drain the V8 microtask queue right after.
- Move on to the next callback or event-loop phase.
The module format changes this. ECMAScript module (ESM) top-level code is evaluated as part of V8's microtask processing. So promises and queueMicrotask() callbacks started at the top level of an ESM file run before process.nextTick() callbacks. In a CommonJS file it is the reverse, process.nextTick() always runs before those promise jobs.
Here is how the order works out. "Microtasks" here means promise reactions and queueMicrotask() callbacks.
| Edge | Practical order |
|---|---|
| CommonJS top level | stack -> next tick -> microtasks -> event-loop work |
| ESM top level | module microtask -> microtasks -> next tick |
| Phase callback | callback -> next tick -> microtasks -> next phase or callback |
When you await something, the code before the await runs synchronously until the async function pauses. The rest of the function resumes as a promise reaction after the awaited value settles.
A Complex Execution Order Analysis
This CommonJS example leaves out top-level zero-delay timers so the output is the same on every run.
const fs = require("node:fs");

console.log("1. Start");
Promise.resolve().then(() => console.log("4. Promise"));
process.nextTick(() => console.log("3. nextTick"));

fs.readFile(__filename, (error) => {
  if (error) throw error;

  console.log("5. I/O Callback");
  setTimeout(() => console.log("9. Timeout from I/O"), 0);
  setImmediate(() => console.log("8. Immediate from I/O"));
  process.nextTick(() => console.log("6. nextTick from I/O"));
  Promise.resolve().then(() => console.log("7. Promise from I/O"));
});

console.log("2. End");
Run it and you always get this output.
1. Start
2. End
3. nextTick
4. Promise
5. I/O Callback
6. nextTick from I/O
7. Promise from I/O
8. Immediate from I/O
9. Timeout from I/O
The order has nothing to do with the API names. It is driven entirely by where each task is scheduled.
First, "1. Start" and "2. End" print synchronously, since they run directly on the main call stack. When the main script finishes and the stack clears, Node drains its high-priority queues, process.nextTick() first, then the V8 promise jobs.
A moment later the file read finishes and the fs.readFile() callback fires from an I/O path. Inside that callback, before Node moves past the return point and continues through the loop, it clears the new next-tick and promise callbacks created in the handler. Only when those queues are empty does Node advance. The immediate callback runs next in the check phase, and the zero-delay timer waits until after the check phase finishes.
Add a top-level setTimeout(..., 0) next to the fs.readFile() call and do not expect one fixed output. On newer Node versions, that timer and the file callback can swap places depending on your startup speed, machine-specific timer thresholds, and how fast the operating system finishes the read.
This same model becomes a performance problem the moment one callback holds control too long.
Event Loop Performance Problems
All this scheduling only works if your callbacks return quickly. When one callback runs too long, it holds up everything behind it, no matter which phase or queue those tasks came from.
Some blockers are obvious, like synchronous APIs such as fs.readFileSync() or heavy CPU-bound loops. The trickier ones are everyday JavaScript operations that look harmless until they hit a large input.
Large JSON work is the common example. JSON.parse() and JSON.stringify() are synchronous. Their time scales with input size, so a large payload holds the event loop long enough to raise your latency. For large JSON, enforce strict size limits or move to a streaming parser. We cover streaming in the streams chapter.
Complex regular expressions can be worse, because an attacker can craft input to exploit them. A badly built regex can trigger catastrophic backtracking, where the regex engine retries an exploding number of paths and freezes the event loop. At that point it is no longer a small performance hiccup but a denial-of-service (DoS) risk. Avoid nested quantifiers, overlapping alternatives, and backreferences in validation paths unless you have tested the worst case.
The Libuv Worker Pool Revisited
The libuv worker pool is global and shared across the whole application, with four threads by default. Functions like fs.readFile() and crypto.pbkdf2() are asynchronous on the JavaScript side, but the native file-system or crypto work can still sit waiting in that single shared native queue.
Because the pool is shared, unrelated tasks block each other. Say your server uses fs.readFile() to read a file from a slow network drive and crypto.pbkdf2() to verify a password at the same time. Both compete for the same small set of background threads. If five such requests arrive together, they fill the queue, and that hidden coupling shows up as a spike in user latency.
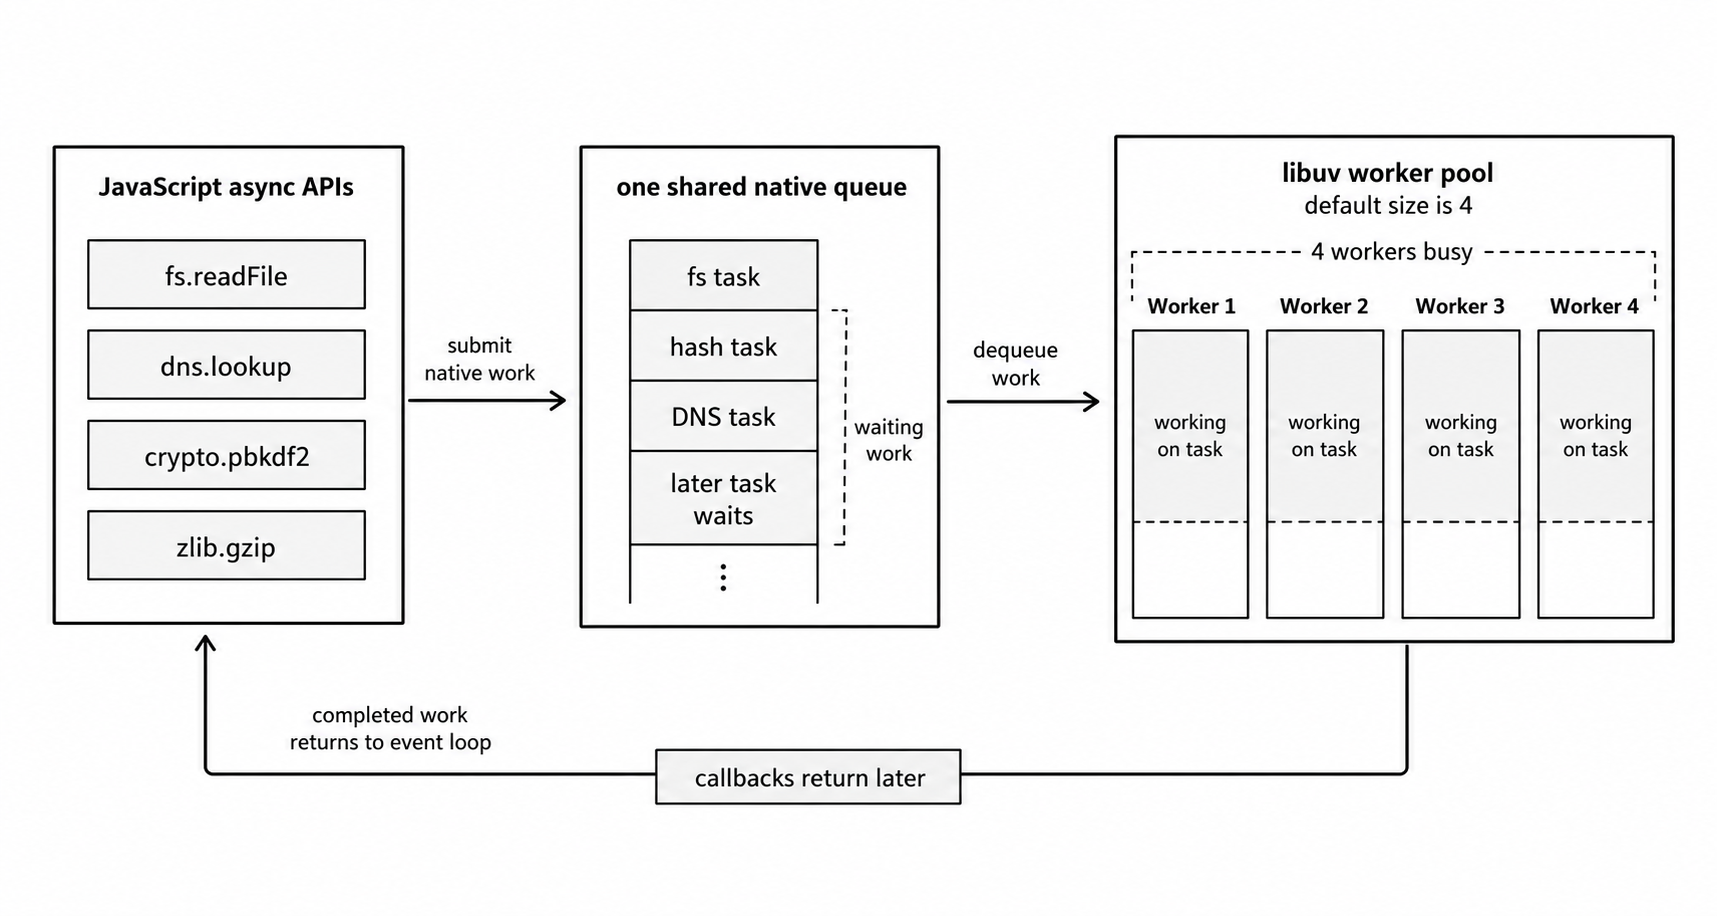
Figure 2 - Worker-pool APIs can be asynchronous to JavaScript while still sharing one native queue. When all workers are busy, filesystem, DNS, crypto, or zlib work can delay one another.
- The first four requests each dispatch a task to the worker pool. If the file reads arrive first, all four threads are busy.
- The fifth request calls
fs.readFile(). libuv tries to hand it off, but the pool is full, so the task waits in the queue. - The password hashing for those four requests also waits in that queue until a file read finishes and frees a thread.
That is how a slow file-system task drags down your authentication latency. Everything in the libuv worker pool shares the same threads. Heavy file I/O, dns.lookup(), crypto, and zlib compression all compete for them.
When performance dips, the first instinct is to raise UV_THREADPOOL_SIZE. Do not do that blindly. Measure your pool pressure first. More threads can raise throughput, but they are not free, they raise your memory footprint and add CPU scheduling overhead.
Profiling and Debugging the Event Loop
Knowing how the event loop orders tasks does not tell you whether your loop is healthy. For that, you measure it.
A quick local signal is a timer-based latency check. It only makes sense in a long-running server, not a one-shot script, because it tracks how late an interval callback arrives.
let lastCheck = Date.now();

setInterval(() => {
  const now = Date.now();
  const delay = now - lastCheck - 1000;
  if (delay > 50) console.warn(`Event Loop Latency: ${delay}ms`);
  lastCheck = now;
}, 1000);
When those warnings appear, your interval callback was pushed back. Usually a long-running callback, a garbage collection pause, or a heavy synchronous operation is holding the main thread.
For continuous production monitoring, skip the manual timer and use Node's built-in histogram tool.
const { monitorEventLoopDelay } = require("node:perf_hooks");
const h = monitorEventLoopDelay({ resolution: 10 });
h.enable();

setInterval(() => {
  console.log("Event Loop Delay (ms):", h.mean / 1_000_000);
  h.reset();
}, 5000);
This histogram records nanoseconds, so divide by 1_000_000 for milliseconds. To see how much time the loop spends working versus sitting idle, pair these delay metrics with performance.eventLoopUtilization().
For deeper, low-level diagnostics, async_hooks tracks the full lifecycle of your asynchronous resources. It carries real performance overhead and complexity, so leave it to APM (application performance monitoring) vendors and targeted debugging sessions rather than running it constantly in production.
CPU-Bound Work and Worker Threads
Some tasks are genuinely CPU-heavy. Asynchronous I/O does not make CPU work disappear. It only stops I/O waiting from holding the JavaScript call stack.
Partitioning on the Event Loop
If a large task can be split into pieces, use partitioning. You do a small slice of the work, yield to the event loop with setImmediate(), then continue where you left off on the next pass. This keeps the application responsive to other requests, but it does not make the total computation finish any faster.
const bigArray = Array.from({ length: 1_000_000 }, (_, i) => i);
let sum = 0;
let index = 0;

function processChunk() {
  const end = Math.min(index + 1000, bigArray.length);
  for (; index < end; index++) sum += bigArray[index];
  if (index < bigArray.length) setImmediate(processChunk);
  else console.log("Processing complete. Sum:", sum);
}
The approach tracks progress with an index pointer instead of slicing or shifting a large array in memory. Each callback does a bounded amount of work, then yields so other waiting callbacks get a turn. To let the rest of your application run before the first chunk starts, begin the process with a scheduling point.
setImmediate(processChunk);
console.log("Started processing...");
True Parallelism with worker_threads
We cover worker_threads in detail in later chapters. Here we are only looking at when standard event-loop scheduling is no longer enough.
For heavy, CPU-bound JavaScript inside one process, use the node:worker_threads module. A worker thread is not the same as one of libuv's background worker-pool threads. It is a separate thread with its own V8 isolate, a private instance of the engine with its own heap, and its own event loop.
Because workers run in isolation, they do not share JavaScript objects by reference. By default, data you send between them is cloned or transferred. You can share raw memory with a SharedArrayBuffer, or pass ArrayBuffer instances directly, but that brings race conditions and coordination bugs unless you guard access with Atomics. For most work, plain message passing is the safer default.
We'll talk all about SharedArrayBuffer, ArrayBuffer and Atomics in an upcoming chapter - Views, Copies and Memory Ownership
// cpu-worker.js
const { parentPort, workerData } = require("node:worker_threads");

let result = 0;
for (let i = 0; i < workerData; i++) {
  result += i;
}

parentPort.postMessage(result);
The main thread starts the worker and waits for its result.
const { join } = require("node:path");
const { Worker } = require("node:worker_threads");

const worker = new Worker(join(__dirname, "cpu-worker.cjs"), {
  workerData: 50_000_000,
});

worker.once("message", (result) => console.log("Worker result:", result));
worker.once("error", (error) => console.error("Worker failed:", error));
Because the loop runs inside the worker, the main thread's event loop stays free to handle incoming request callbacks. One performance note. If your application runs repeated CPU tasks, keep a persistent worker pool instead of spawning a new worker for every job, since startup is not free.
If you've worked with other languages like C, C++ or Rust, you probably know how to do that, if not, we'll go really deep into this territory in Volume 3 of NodeBook.
The cluster Module
Don't confuse worker_threads with the cluster module. I assumed for a long time they were nearly the same thing, built for the same job. They are not.
They look similar but solve different problems. cluster runs multiple Node processes that share the same server ports. It is built for scaling a whole server across CPU cores and keeping the processes isolated. It is not for offloading a single heavy calculation inside one request handler.
cluster is built on child_process.fork(). A primary process hands out incoming network connections to the workers. Each worker is a fully independent process with its own event loop, its own V8 instance, its own memory, and its own process ID.
Use worker_threads when one process needs to run JavaScript in parallel. Use cluster when you want separate process instances that share server ports and stay isolated from each other.
You have probably used this already, indirectly, if you run your service with PM2, for example pm2 start app.js. It does the same clustering, managed for you.
setTimeout vs setImmediate
Let's go back to these two. The question of which one runs first is worth understanding, because the answer shows exactly how Node schedules work.
setTimeout(..., 0) vs. setImmediate()
The short answer is it depends entirely on where you call them.
Case 1 - Calling them from the main script
setTimeout(() => console.log("Timeout"), 0);
setImmediate(() => console.log("Immediate"));
Run this as a standalone script and the order is unpredictable. You might see Timeout first, or Immediate first. A timer delay is a minimum threshold, not an exact guarantee. Depending on how fast the process starts, the timer can cross its threshold before the loop has even set up its phases. So never write production logic that depends on which one runs first here.
Case 2 - Calling them from inside an I/O callback
const fs = require("node:fs");

fs.readFile(__filename, (error) => {
  if (error) throw error;

  setTimeout(() => console.log("Timeout"), 0);
  setImmediate(() => console.log("Immediate"));
});
Here setImmediate() always runs first. The file-reading callback runs inside libuv's poll phase. When it finishes and schedules both the timer and the immediate, the loop moves to the next step, the check phase, where setImmediate() runs. The timer has to wait until the loop comes back around to the timer phase.
Garbage Collection and Loop Latency
V8's garbage collector adds to event-loop latency too. Much of the cleanup runs incrementally or in the background, but you still hit stop-the-world pauses where all JavaScript execution stops. Usually these pauses are small and go unnoticed. Under heavy memory pressure they stack up and show as spikes in your tail latency, the slowest end of your response-time distribution.
During a pause, no JavaScript callback runs. From the outside, the process looks frozen, the same as a heavy synchronous CPU task on the main thread. To keep these pauses small, keep your allocation rate down and avoid holding large amounts of memory in the heap that you do not need.
Here is the whole model in one place. JavaScript runs until it finishes. Node drains process.nextTick() and promise microtasks the moment a callback returns. libuv advances native work phase by phase. Zero-delay timers are minimum thresholds, never a guarantee of which code runs first. When you need a specific order, structure the execution yourself instead of guessing how the engine will schedule it.